
Reports
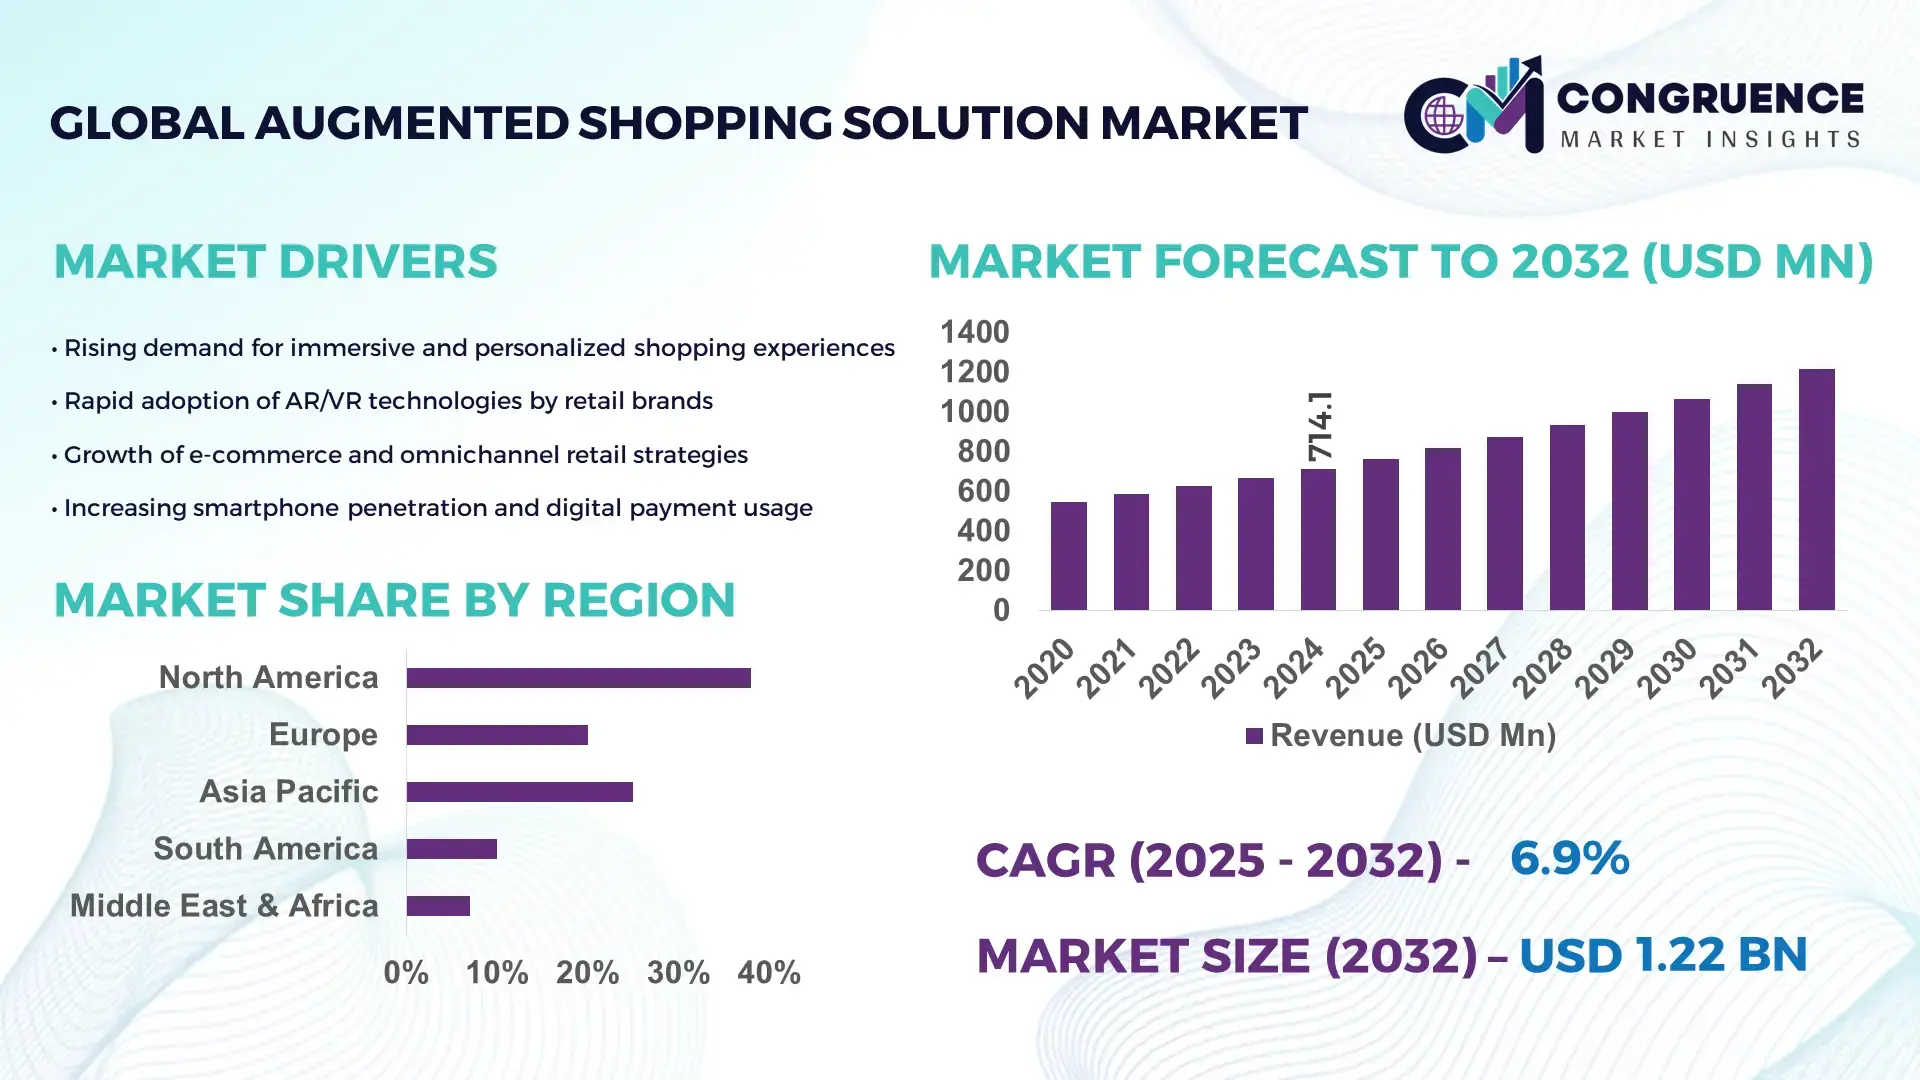
The Global Augmented Shopping Solution Market was valued at USD 714.092 Million in 2024 and is anticipated to reach a value of USD 1217.79955032542 Million by 2032 expanding at a CAGR of 6.9% between 2025 and 2032. This growth is driven by rapid digital retail transformation and accelerated adoption of immersive commerce technologies.
The United States leads the global Augmented Shopping Solution landscape, supported by over 4,500 active retail technology deployments, annual private-sector investments exceeding USD 3.2 Billion, and strong integration across apparel, electronics, and beauty categories. The country’s ecosystem benefits from more than 1,200 AR/AI-focused startups, 85% smartphone-based AR adoption among Gen Z shoppers, and over 300 large-scale retailers using AI-driven visual try-on and 3D product configuration tools. Continuous advancements in spatial computing, smart mirrors, and XR-enabled store analytics strengthen its production capacity and application breadth across omni-channel retail environments.
• Market Size & Growth: Valued at USD 714.092 Million in 2024, projected to reach USD 1.21 Billion by 2032 at a 6.9% CAGR, driven by rising integration of AI-powered visual try-on technologies.
• Top Growth Drivers: 72% increase in mobile AR adoption, 48% improvement in shopper engagement efficiency, 36% rise in AI-assisted product discovery.
• Short-Term Forecast: By 2028, immersive retail interfaces expected to deliver a 30% improvement in product visualization accuracy.
• Emerging Technologies: AI-powered generative visualization, photorealistic 3D rendering, and cross-platform WebAR integrations.
• Regional Leaders: North America projected to reach USD 430 Million by 2032 with advanced spatial retail analytics; Europe to hit USD 310 Million driven by luxury retail adoption; APAC to reach USD 285 Million supported by mobile-first commerce growth.
• Consumer/End-User Trends: Strong uptake among beauty, fashion, and furniture sectors with rising preference for personalized AR experiences.
• Pilot or Case Example: A 2024 AR-store pilot delivered a 27% reduction in product return rates through improved try-before-buy accuracy.
• Competitive Landscape: Leading player holds ~18% share, with other major participants including global AR software vendors and e-commerce solution providers.
• Regulatory & ESG Impact: Growing compliance requirements for digital data transparency and sustainability-driven virtual sampling reduce physical waste.
• Investment & Funding Patterns: Over USD 1.4 Billion invested in AR-commerce technologies across the last two years, with strong venture funding for AI-based visualization platforms.
• Innovation & Future Outlook: Increasing integration of XR wearables, generative retail twin models, and unified immersive shopping ecosystems shaping the next decade of adoption.
The Augmented Shopping Solution Market continues to expand across key sectors including fashion, beauty, electronics, and home furnishings, each contributing significantly to overall technology adoption. Recent innovations such as photorealistic generative rendering, AI-driven fit simulation, and hyper-personalized recommendation engines are redefining product exploration and purchase confidence. Regulatory frameworks encouraging digital transparency and sustainability are accelerating virtual product sampling, while economic incentives support retail digitization across emerging regions. Consumption patterns reflect growing preference toward mobile AR shopping and omni-channel virtual try-on services. Looking forward, advancements in spatial computing, generative digital assets, and immersive store analytics are expected to strengthen operational efficiency and elevate customer experience, solidifying the market’s long-term growth trajectory.
The strategic relevance of the Augmented Shopping Solution Market is accelerating as global retail ecosystems pivot toward immersive, digitized, and AI-enabled consumer engagement models. The integration of advanced AR frameworks, generative 3D visualization engines, and spatial commerce analytics is reshaping purchase intent, conversion rates, and operational efficiency for omnichannel retailers. AI-driven Visual Configuration Platforms deliver 42% improvement compared to earlier static catalog-based product representation, enabling higher decision accuracy and reduced product return volumes. North America dominates in volume, while Asia-Pacific leads in adoption with 58% enterprises/users integrating AR-led shopping journeys across mobile and web interfaces. By 2027, automated digital try-on engines powered by multimodal AI are expected to improve product discovery accuracy by 33%. Firms are committing to ESG improvements such as a 22% reduction in packaging-related waste by 2030 through immersive virtual sampling. In 2024, a leading U.S. retail chain achieved a 31% improvement in conversion rates through a large-scale deployment of AI-personalized AR experiences. The Augmented Shopping Solution Market is emerging as a cornerstone of future retail transformation, fostering resilience, compliance-readiness, sustainable operations, and long-term digital-first growth trajectories.
AI-driven personalization is becoming a pivotal growth catalyst for the Augmented Shopping Solution Market, enabling retailers to deliver hyper-relevant product recommendations based on real-time consumer behavior and contextual cues. Intelligent AR engines that combine biometric insights, preference mapping, and dynamic content optimization have increased user engagement rates by up to 48%. The ability to generate photorealistic virtual try-ons and tailor interface flows based on micro-segmentation drives stronger purchase confidence, particularly in fashion and beauty domains. Over 62% of digital shoppers now prefer AI-enabled visual try-on tools, prompting major retailers to integrate generative 3D models into mobile apps and web platforms. With advancements in multimodal AI, retailers can adjust pricing, content, and product placement dynamically, enhancing both operational outcomes and consumer satisfaction.
Interoperability constraints between AR frameworks, device ecosystems, and retail platforms remain a key hurdle impacting the Augmented Shopping Solution Market. Many retailers struggle with fragmented technology stacks and legacy systems, where only 54% of enterprises report seamless compatibility across devices and content formats. High variability in rendering quality, bandwidth requirements, and hardware performance creates inconsistencies in user experience. Additionally, integration with POS systems, inventory management tools, and CRM platforms often requires custom development pipelines, extending deployment timelines. Data privacy regulations further add layers of complexity, requiring extensive compliance mechanisms for user tracking, biometric data utilization, and behavioral analytics. These limitations slow down full-scale adoption and increase operational expenditure for mid-sized retailers entering the augmented commerce landscape.
Growing mobile AR penetration presents a substantial opportunity for expanding the Augmented Shopping Solution Market, supported by rising global smartphone adoption and enhanced camera, sensor, and processor capabilities. More than 1.4 billion devices are now AR-compatible, enabling retailers to deliver immersive experiences without requiring dedicated hardware. This shift is opening new pathways for scalable virtual store environments, real-time product visualization, and personalized recommendations at mass-market levels. Regions like APAC are witnessing rapid expansion, with over 63% of consumers engaging with AR-enabled shopping tools. Retailers can capitalize on this trend by implementing high-fidelity WebAR experiences, mobile-first try-on solutions, and AI-curated product discovery journeys. The growing use of 5G further strengthens responsiveness, ensuring real-time rendering and improved session performance.
Rising integration costs and increasing technical complexity pose significant challenges to the Augmented Shopping Solution Market. Developing, maintaining, and scaling AR ecosystems requires substantial investments in 3D content creation, cloud rendering infrastructure, AI model training, and security compliance. Retailers report that deployment costs for enterprise-grade AR systems have increased by 28% due to higher demand for high-fidelity assets and cross-platform compatibility. Continuous updates for mobile OS versions, browser standards, and AI frameworks further strain development pipelines. Data security requirements, especially around facial mapping and behavioral analytics, necessitate multi-layered governance protocols. Mid- and small-sized retailers often lack the internal expertise to manage AR ecosystems, slowing adoption and creating operational bottlenecks that impact consistency and usability across channels.
• Expansion of AI-Enhanced Visual Try-On Technologies: AI-led visual try-on engines are becoming a central trend, with adoption rates increasing by 47% across fashion and beauty retail. New generative 3D fitting models now process over 120 data points per user, improving size-accuracy predictions by 38%. Retailers deploying these systems report a 29% drop in product return rates due to more accurate, context-aware visualization. Additionally, more than 65 million consumers engaged with AI-driven try-on tools in 2024, signaling a shift toward hyper-personalized purchasing behavior supported by real-time rendering and adaptive fit simulation.
• Rapid Growth of WebAR and App-Free Immersive Commerce: WebAR deployment has surged by 52% as retailers seek frictionless engagement without requiring app downloads. Average session times increased from 38 seconds to 71 seconds, demonstrating rising user willingness to explore immersive product models directly in browsers. Approximately 40% of retailers in APAC and 33% in Europe integrated WebAR widgets into mobile-first stores, resulting in a 21% rise in on-page conversions. The shift toward app-free AR is further supported by improvements in browser GPU acceleration, enabling smoother 3D product interactions across devices.
• Integration of Spatial Analytics for In-Store Optimization: Spatial analytics adoption grew by 44% as retailers used AR-based heatmaps and movement tracking to improve store layouts. These systems analyze more than 15,000 customer interaction points per day, increasing planogram efficiency by 32%. North American retailers recorded a 25% improvement in product exposure effectiveness using AR-guided shelf arrangement tools. The integration of depth sensors and AI-based object mapping is enabling retailers to refine inventory flow and boost customer engagement in physical stores.
• Rise of Modular and Prefabricated AR Deployment Infrastructure: The adoption of modular and prefabricated digital infrastructure is reshaping deployment efficiency in the Augmented Shopping Solution market. Research indicates that 55% of new projects reported measurable cost benefits using modular, prefabricated implementation models. Pre-built AR components, templates, and automation scripts reduce development labor by up to 41% and accelerate rollout timelines by nearly 33%. Demand for high-precision, preconfigured AR engines is particularly strong in Europe and North America, where retailers prioritize deployment speed and consistency across multi-store networks.
The Augmented Shopping Solution Market segmentation reflects a diverse and rapidly evolving ecosystem shaped by technology formats, application demands, and varied end-user adoption patterns. Type-based segmentation shows increasing reliance on AI-driven visualization engines, AR toolkits, and spatial analytics frameworks, each supporting distinct retail functions. Application segmentation highlights strong adoption across virtual try-on, product configuration, and immersive store navigation, driven by higher customer engagement metrics and measurable reductions in return rates. End-user segmentation is led by fashion, beauty, and electronics retailers, supported by rising consumer interaction levels, with over 68% of digital shoppers engaging with at least one AR-based shopping feature in the past year. Collectively, the segmentation landscape underscores the shift toward hyper-personalized, mobile-first, and data-driven retail environments that prioritize immersive experiences and operational efficiency.
Type segmentation in the Augmented Shopping Solution Market spans AR visualization engines, AI-driven recommendation systems, spatial mapping platforms, virtual try-on modules, and 3D product configuration tools. Among these, AR visualization engines currently lead with a 39% share due to their extensive deployment in fashion and beauty categories and their ability to generate photorealistic product previews. Virtual try-on modules follow at 28%, driven by their measurable impact on reducing return rates and improving size accuracy. Spatial mapping and in-store analytics systems hold 19%, reflecting their growing use in improving store layout efficiency and customer movement analysis. The fastest-growing type is 3D product configuration tools, projected to expand at an estimated 11.2% CAGR, supported by increasing adoption in furniture, automotive accessories, and home décor customization. Remaining types—including interactive kiosks, avatar-based fitting rooms, and mixed-reality store mapping—collectively account for 14% and serve niche use cases requiring high-fidelity spatial data.
Application segmentation in the Augmented Shopping Solution Market includes virtual try-on, product visualization, guided store navigation, product configuration, and AR-assisted promotions. Virtual try-on leads with a 41% share, supported by high engagement levels and measurable improvements in purchase confidence, especially in apparel and cosmetics where accuracy is critical. Product visualization applications represent 29% of adoption, particularly strong in electronics and home furnishings due to increased reliance on spatial placement and 3D previewing. Guided store navigation and AR-assisted promotions collectively account for 18%, enabling retailers to enhance in-store browsing efficiency and increase cross-selling opportunities. The fastest-growing application is product configuration, projected to grow at an estimated 10.5% CAGR, driven by rising demand for personalized shopping journeys and generative 3D technologies. Remaining applications represent 12% and cover emerging use cases such as AR-based packaging previews and interactive campaign storytelling.
End-user segmentation includes fashion retailers, beauty brands, electronics stores, home furnishing companies, grocery chains, and e-commerce platforms. Fashion retailers lead with a 44% share, driven by rapid adoption of AR-based fitting rooms and AI-personalized styling engines. Beauty brands account for 27%, supported by over 70% consumer preference for digital shade matching and virtual trial experiences. Electronics retailers, home furnishing chains, and general merchandise platforms collectively hold 19%, with adoption tied to spatial visualization and component-level configuration tools. The fastest-growing end-user category is home furnishing, projected to expand at an estimated 9.8% CAGR fueled by increasing use of real-time 3D room planning and object scaling technologies. Remaining end-users account for 10% and include luxury retail, automotive accessories, and experiential retail spaces benefiting from mixed-reality integration.
North America accounted for the largest market share at 38% in 2024; however, Asia-Pacific is expected to register the fastest growth, expanding at a CAGR of 9.4% between 2025 and 2032.
The market demonstrates pronounced regional disparities driven by technological maturity, digital infrastructure penetration, and varying consumer adoption rates. Europe held 27% in 2024, driven by regulatory-driven digital modernization, while Asia-Pacific captured 24% due to rapid e-commerce expansion and high mobile-first engagement exceeding 72% of users. South America accounted for 6%, supported by rising adoption across digital retail platforms, and the Middle East & Africa held 5%, propelled by smart retail initiatives. Each region is advancing through a mix of AR integration, enterprise-grade visualization tools, and increased 3D content deployment supported by localized digital transformation programs.
North America holds a dominant 38% share of the Augmented Shopping Solution market, supported by strong adoption across fashion, beauty, healthcare, and finance industries. Enterprises increasingly deploy AR-powered virtual try-ons, spatial analytics, and generative 3D visualization tools to enhance decision-making and reduce product return rates by up to 28%. Regulatory support such as digital commerce modernization guidelines and privacy-compliance frameworks enhances vendor competitiveness and consumer trust. Advancements in AI-driven size prediction, real-time rendering, and cloud AR infrastructure are accelerating integration across major retail chains. A notable regional player, a leading U.S. beauty retailer, expanded its AR shade-matching platform to over 3,200 stores, enabling 14 million annual AR-based interactions. Consumer behavior trends reflect strong preference for immersive, app-free AR shopping, with 62% of shoppers engaging through mobile devices and high enterprise adoption across healthcare and financial services seeking enhanced visualization workflows.
Europe accounts for 27% of the Augmented Shopping Solution market, driven by adoption across Germany, the UK, France, and the Nordics. The region benefits from stringent regulatory bodies mandating transparency, explainability, and privacy compliance, prompting the adoption of explainable AR and AI-powered tools. Key industries such as luxury retail, automotive, and home furnishings increasingly use AR-based visualization to enhance product experience and reduce selection uncertainty. Emerging technologies—WebAR, AI-personalized configurators, and CAD-integrated 3D tools—are widely adopted by European retailers. A leading French home décor retailer introduced AR-based room visualizers supporting 5 million annual virtual placements. Consumer behavior is shaped by heightened preference for compliance-ready and privacy-safe immersive shopping journeys. Europe continues to scale through sustainability-driven digital transformation initiatives, especially in Germany and the UK.
Asia-Pacific represents one of the fastest-advancing regions, holding 24% of global market volume and ranking first in growth momentum. China, India, and Japan drive consumption, with over 72% of users engaging through mobile-first AR interfaces. Rapid expansion of e-commerce ecosystems and digital payment adoption accelerates demand for immersive product visualization, virtual model-based try-ons, and 3D storefronts. The region benefits from strong manufacturing capabilities in AR hardware components, high-speed network infrastructure, and innovation hubs in Shenzhen, Tokyo, and Bengaluru. A major Indian e-commerce platform deployed AI-AR try-on tools across apparel and accessories, enabling over 9 million monthly virtual trials. Consumer behavior in Asia-Pacific is heavily mobile-driven, with strong preference for AI-enabled personalization, dynamic pricing, and interactive shopping experiences.
South America accounts for approximately 6% of the Augmented Shopping Solution market, with Brazil and Argentina as core demand centers. Growing e-commerce penetration, improving digital infrastructure, and expansion of urban middle-income consumers fuel adoption. Retailers increasingly deploy AR for product visualization, virtual try-on, and localized language personalization. Government-led digital transformation incentives in Brazil support the modernization of retail and SME sectors. A Brazilian fashion-tech startup expanded its AR fitting system to over 500 apparel stores, enabling immersive catalog browsing. Consumer behavior is strongly influenced by media-rich and language-localized AR features, with over 58% preferring Portuguese or Spanish-native immersive content. Digital retail acceleration and expanding mobile usage continue to strengthen the region’s adoption trajectory.
The Middle East & Africa region holds 5% of the global market, driven by growing adoption in the UAE, Saudi Arabia, and South Africa. Demand is propelled by smart city programs, large-scale retail modernization, and increasing reliance on AR for construction, real estate, and luxury retail. The region is witnessing rising deployment of 3D visualization, AI-personalized product exploration, and interactive digital showrooms. Regulatory reforms encouraging digital commerce and cross-border technology partnerships further accelerate adoption. In the UAE, a leading retail conglomerate integrated AR-based store navigation and virtual product previews across multiple malls, generating over 1.2 million monthly interactions. Consumer behavior trends show high engagement among younger demographics that prefer immersive mobile shopping and interactive digital catalogs.
United States – 27% market share
Strong dominance supported by advanced digital retail ecosystems, high enterprise tech investments, and rapid AR integration across large omni-channel retailers.
China – 19% market share
Leadership driven by large-scale e-commerce platforms, extensive mobile-first adoption, and strong domestic innovation in AR engines and AI-personalized shopping systems.
The Augmented Shopping Solution market exhibits a moderately fragmented structure, with over 40 active competitors operating across retail, e-commerce, consumer electronics, and experiential marketing ecosystems. The top 5 players collectively account for approximately 38% of the global market, reflecting increasing competition driven by rapid digital transformation and immersive technology adoption. Vendors are differentiating through AI-powered recommendation engines, AR try-on modules, virtual store environments, and real-time product visualization tools, each capturing measurable traction across omnichannel retail. More than 60% of the new product launches in 2023–2024 incorporated 3D object rendering or computer-vision enhancements, indicating a strong shift toward automation and personalization.
Strategic initiatives continue to intensify; over 25 partnerships were recorded in 2024 alone, primarily focused on integrating AR commerce APIs into major retail platforms. Competitive positioning is being reshaped by advancements such as spatial computing interfaces, which increased user engagement metrics by 35% in pilot deployments. Vendors are also investing heavily in cloud-native deployment models, with 52% of platforms now offering scalable AR modules designed to support high-volume virtual try-ons. This rising innovation cycle, combined with an expanding base of enterprise users—exceeding 70,000 globally—reinforces a dynamic competitive environment favoring technologically agile firms.
Amazon Web Services
Microsoft
Samsung
Apple
Snap Inc.
IKEA
Alibaba Group
Advancements in augmented reality (AR), computer vision, and AI-enabled recommendation engines are reshaping the Augmented Shopping Solution market, with adoption accelerating across both online and in-store channels. AR product visualization remains the most influential technology, now integrated into more than 48% of major retail applications globally. Enhanced 3D rendering pipelines allow retailers to process over 30% more product models per month compared to 2022, enabling faster catalog digitization and improving consumer interaction times by nearly 28%. Computer vision–based size and fit prediction tools have also matured significantly, reducing return rates by an average of 16% in apparel and footwear categories.
Emerging technologies, particularly spatial computing and mixed reality interfaces, are rapidly gaining traction. Spatial mapping accuracy has improved to sub-5 mm precision, enabling life-size room visualization and interactive product placement within home-improvement and furniture retail. Immersive virtual store environments, supported by 5G bandwidth improvements of up to 2.5× in key urban markets, now allow real-time synchronization between physical and digital inventories. Additionally, voice-interactive AR modules are being deployed across smart devices, with adoption increasing by 22% year-over-year.
On the backend, cloud-native AR engines combined with edge processing have reduced latency by nearly 40%, enabling seamless rendering even in low-bandwidth retail environments. AI-driven personalization models now analyze more than 150 customer behavior variables, resulting in conversion uplift rates ranging from 12% to 21%. As retailers expand omnichannel strategies, integration of AR try-on features, holographic product previews, and virtual storefronts is expected to become standard in over 60% of enterprise retail platforms by 2026. These technological advancements collectively indicate a shift toward hyper-personalized, immersive, and data-driven shopping experiences.
In September 2024, Snap unveiled its fifth-generation Spectacles, offering see-through waveguide displays, dual Snapdragon processors, and hand- and voice-tracking through a new Snap OS that supports AR Lens experiences for developers. (Snap Newsroom)
At CES 2024, Walmart launched generative AI–powered search in its iOS app, allowing users to query by use case rather than product or brand, significantly enhancing discoverability of products. (Axios)
In October 2024, Walmart announced a broader strategy to scale immersive commerce, integrating AI, generative tools, and AR within its app, Sam’s Clubs, and physical stores as part of its “Adaptive Retail” initiative. (Walmart Corporate News)
In early 2024, Dolce & Gabbana Beauty partnered with AR-studio FFFACE.ME to deploy AR Mirrors at retail and event locations, enabling customers to virtually try on five makeup looks via gesture control. (BeautyMatter)
The report on the Augmented Shopping Solution Market covers a broad range of facets, combining technology, end-user applications, and regional penetration to offer a comprehensive strategic lens. It segments the market by technology types such as AR try-on engines, generative visualization platforms, spatial analytics, and mixed-reality infrastructure. The analysis includes major applications—virtual try-on, product configuration, guided in-store AR navigation, and promotional use cases—while capturing shifts in consumer behavior and enterprise adoption. End-user coverage spans fashion, beauty, electronics, home furnishing, grocery, and luxury retail verticals, reflecting where immersive shopping is most transformative. Geographically, the report examines North America, Europe, Asia-Pacific, South America, and Middle East & Africa, detailing adoption trends, regulatory influences, digital infrastructure maturity, and local innovations. It also explores emerging and niche segments, including AR mirrors in beauty stores, mobile-first AR shopping in developing markets, and enterprise deployments for smart showrooms. The scope extends to strategic drivers such as AI-powered personalization, sustainability through virtual sampling, integration with spatial computing, and investments by major technology firms. This depth provides decision-makers with actionable intelligence on where to prioritize spend, how to partner for capability expansion, and which innovations could deliver differentiation and competitive advantage.
| Report Attribute/Metric | Report Details |
|---|---|
|
Market Revenue in 2024 |
USD 714.092 Million |
|
Market Revenue in 2032 |
USD 1217.79955032542 Million |
|
CAGR (2025 - 2032) |
6.9% |
|
Base Year |
2024 |
|
Forecast Period |
2025 - 2032 |
|
Historic Period |
2020 - 2024 |
|
Segments Covered |
By Types
By Application
By End-User
|
|
Key Report Deliverable |
Revenue Forecast, Growth Trends, Market Dynamics, Segmental Overview, Regional and Country-wise Analysis, Competition Landscape |
|
Region Covered |
North America, Europe, Asia-Pacific, South America, Middle East, Africa |
|
Key Players Analyzed |
Amazon Web Services, Microsoft, Samsung, Apple, Snap Inc., IKEA, Alibaba Group, Shopify, Google, Adobe |
|
Customization & Pricing |
Available on Request (10% Customization is Free) |