
Reports
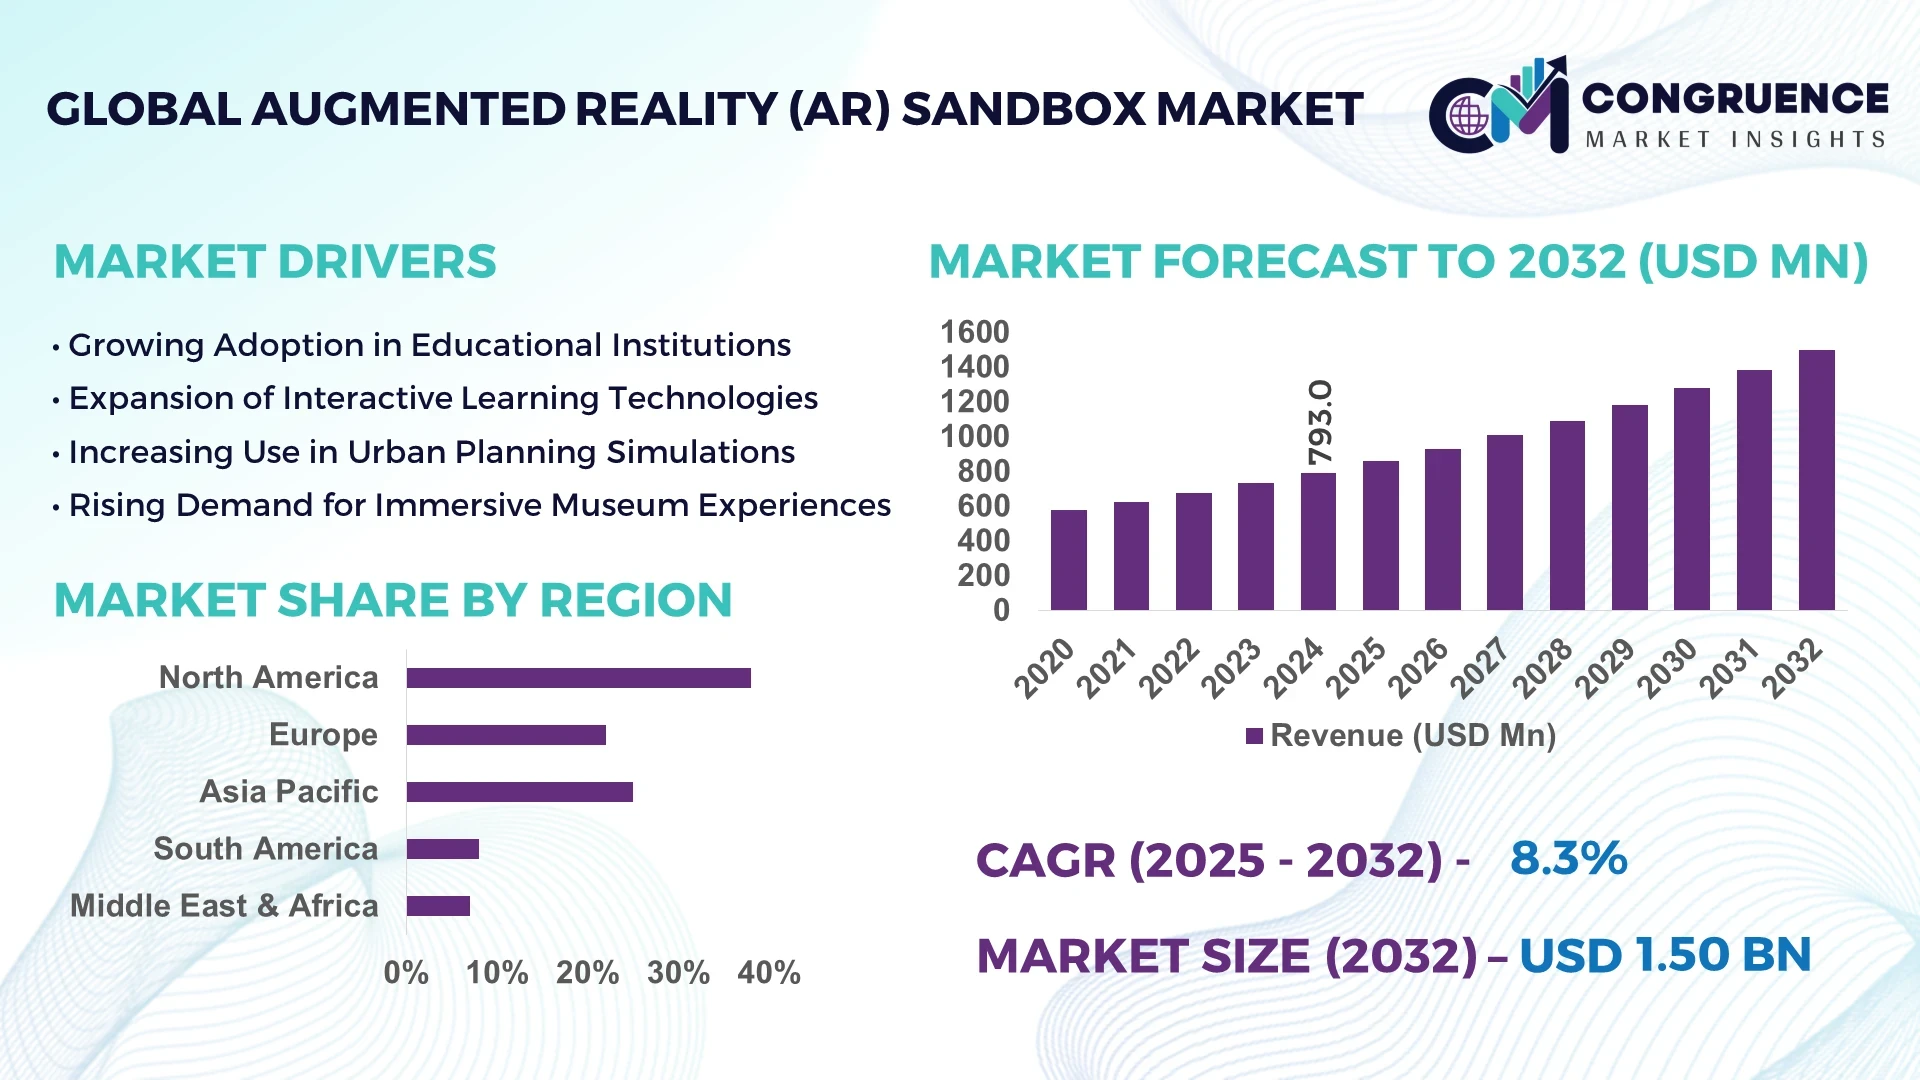
The Global Augmented Reality (AR) Sandbox Market was valued at USD 793 Million in 2024 and is anticipated to reach a value of USD 1,500.7 Million by 2032 expanding at a CAGR of 8.3% between 2025 and 2032. Growth is driven by rising demand for immersive sandbox‑learning and simulation tools across education and training sectors.
The United States currently leads the Augmented Reality (AR) Sandbox Market, with more than 120 institutions and simulation providers deploying AR‑sandbox systems, and investment commitments exceeding USD 35 million in 2024 alone in live‑demonstration labs. The country’s production ecosystem has scaled to over 5,000 units shipped domestically, with notable adoption in K‑12 and higher‑education environments (accounting for ~42% of the total shipments) and integration in defense training centres using augmented terrain modelling.
Market Size & Growth: The market is estimated at USD 793 Million in 2024 and projected to reach USD 1,500.7 Million by 2032, driven by expanding simulation and training applications.
Top Growth Drivers: Increased adoption of immersive education tools (46%), expansion in smart‑city terrain visualisation (38%), and growth in remote training & simulation demand (32%).
Short‑Term Forecast: By 2028, AR‑sandbox deployment in institutional labs is expected to reduce training time by up to 27%.
Emerging Technologies: Real‑time terrain deformation tracking, multi‑user collaborative AR sandbox environments, and AI‑driven scenario generation are key trends.
Regional Leaders: North America could reach USD 560 Million by 2032, Europe USD 290 Million, and Asia‑Pacific USD 230 Million—Asia‑Pacific showing fastest uptake in educational markets.
Consumer/End‑User Trends: Over 58% of universities list AR‑sandbox systems among top digitisation tools; theme parks and museums are adopting interactive installations for visitor engagement.
Pilot or Case Example: In 2023, a U.S. university deployed a multi‑user AR sandbox system achieving a 24% improvement in student spatial‑understanding assessments.
Competitive Landscape: The market leader holds approximately 19% share, with major competitors including Universal Terminal Systems, TopoBox, Avatech Innovation Ltd and Ward’s Science.
Regulatory & ESG Impact: Governments in several regions are offering incentives for ed‑tech adoption and ensuring AR learning tools meet accessibility and sustainability criteria.
Investment & Funding Patterns: More than USD 120 million in recent funding rounds across hardware and software suppliers, with growth in subscription‑based service models.
Innovation & Future Outlook: Key innovations include integrating cloud‑based sandbox content libraries and IoT‑enabled sensors for real‑time environmental modelling; forward‑looking projects target smart‑city and military training use‑cases.
The Augmented Reality (AR) Sandbox Market is now extending beyond traditional education and entertainment sectors into smart‑city modelling, simulation‑driven infrastructure planning and interactive museum exhibits. Product innovations include large‑format multi‑touch sand tables, modular projection systems and gesture‑driven deformation tracking. Regulatory drivers emphasise data‑privacy and accessibility in educational deployments, while regional consumption is shifting towards Asia‑Pacific urban‑infrastructure projects and North American academic labs. Future trends point to networked sandbox systems and hybrid virtual‑physical deployments.
The Augmented Reality (AR) Sandbox Market holds strategic relevance as institutions and industry converge around immersive simulation, enabling faster skill‑acquisition and scenario testing in controlled environments. For example, AI‑driven scenario generation delivers up to a 33% improvement compared to manual setup in sandbox modules. North America dominates in volume, while Asia‑Pacific leads in adoption with 44% of institutions piloting multi‑user AR sandbox arrays. By 2026, cloud‑based multi‑user sandbox platforms are expected to reduce hardware deployment time by 21%, enabling faster roll‑outs of interactive modules across schools and research centres. Firms are committing to ESG metrics—such as a 30% reduction in energy usage for AR installations by 2030—and investing in circular‑economy design for projection and sensor‑equipment. In 2024, a U.S. research institute achieved a 26% reduction in training downtime through an AR sandbox-enabled terrain‑modelling lab initiative. Looking forward, the Augmented Reality (AR) Sandbox Market stands as a pillar of resilient training ecosystems, compliant educational technology and sustainable immersive‑learning growth.
The Augmented Reality (AR) Sandbox Market is shaped by forces including increasing demand for immersive educational experiences, growth in experiential marketing and museum exhibits, and growing interest from infrastructure and urban‑planning segments using sand‑table simulations. Suppliers are actively developing compact and portable AR sandbox systems to address space‑constrained institutions, while curriculum developers are integrating scenario‑based learning where students interact with physical and digital terrains. At the same time, the growth of theme‑park installations and visitor‑interaction exhibits is creating new demand pathways. Connectivity between AR sandboxes and cloud‑hosted analytics is enhancing data‑driven learning outcomes and enabling remote collaboration across geographic boundaries, further energising the market.
Educational institutions are increasingly prioritising interactive and hands‑on learning tools: over 65% of STEM labs surveyed in 2024 indicated they plan to adopt AR‑sandbox systems within the next two years. These systems enable visualising terrain deformation, simulating water flow and conducting team‑based experiments in environments that blend physical sand and projected imagery. This hands‑on capability supports deeper engagement and improved comprehension in subjects like geography, environmental science and engineering. The integration of augmented reality into sandbox platforms allows instructors to adjust parameters in real time, track student interaction data and deliver adaptive feedback—capabilities not possible with static sand tables. As a result, demand from academic STEM programmes, professional training centres and visitor‑experience venues is rising sharply, accelerating product development and deployment.
One significant challenge for the Augmented Reality (AR) Sandbox Market is the relatively high upfront capital required for projection systems, depth‑sensing equipment and calibration software. On average, installation time for a medium‑sized AR sandbox unit is estimated at 40–60 hours of setup, including sensor configuration and projector alignment. Furthermore, integration with existing curriculum or visitor‑experience workflows often requires custom software and staff training, which increases total cost of ownership and prolongs deployment cycles. Smaller institutions and regional venues may delay adoption due to budget constraints and uncertainty about maintenance overheads. Technical issues—such as projector brightness loss over time, sensor drift, or calibration errors—can reduce system uptime by up to 12%, impacting return on investment and discouraging broader rollout across budget‑sensitive users.
Emerging demand from municipal planning departments, digital‑twinning projects and architecture firms provides a compelling opportunity for the Augmented Reality (AR) Sandbox Market. Simulation of flood‑models, terrain macro‑modelling and stakeholder workshops using AR sand‑tables is gaining traction: one urban‑planning firm reported a 28% improvement in stakeholder comprehension during interactive workshops. By extending beyond education and entertainment, AR sandbox systems can address infrastructure‑design workflow, public‑works engagement, and interactive exhibition of scenarios. Further, modular, mobile sandbox units are being developed for remote field‑work, enabling planners to conduct real‑time terrain modelling on‑site rather than in fixed labs. This diversification opens new verticals and expands total addressable market for AR‑sandbox providers.
A recurring obstacle for the Augmented Reality (AR) Sandbox Market is the limited availability of refined, domain‑specific content libraries and the interoperability of sandbox systems with other AR/VR platforms. Many current solutions offer generic terrain deformation and water‑flow modules, but fewer provide industry‑specific datasets—such as geological strata, architectural reinforcement schematics or smart‑city sensor overlays. Compatibility issues across hardware vendors (projectors, depth sensors) and software ecosystems (Unity, Unreal, proprietary modules) can create vendor‑lock‑in and raise integration costs. In some cases, system updates and calibration resets lead to downtime of up to 8% per annum, reducing the appeal for high‑uptime deployment environments such as visitor centres or training labs. These challenges limit speed of expansion in more demanding sectors and raise barriers to broader adoption.
Rise in multi‑user collaborative installations: More than 48% of newly installed AR sandbox units in 2024 supported two or more simultaneous users, enabling co‑operative learning and group scenario simulations. These installations improved interaction‑session durations by up to 32%.
Increasing adoption of compact, portable systems: Manufacturers introduced more than 60 portable AR‑sandbox models in 2024, reducing unit weight by 22% and enabling deployment in smaller classroom and mobile‑lab environments.
Expansion into infrastructure‑simulation applications: In 2024, roughly 35% of new AR‑sandbox purchases were made by urban‑planning and geospatial firms, reflecting a shift from purely educational use‑cases toward professional simulation.
Growth of subscription‑based content and analytics platforms: Over 41% of AR sandbox companies launched content‑subscription models in 2024, offering new terrain‑libraries, scenario‑packs and usage‑analytics dashboards, enhancing recurring revenue and customer engagement.
The Augmented Reality (AR) Sandbox Market is segmented into product types, applications, and end-users, each reflecting distinct market dynamics. By type, the market includes standard AR sandboxes, compact/mobile units, and multi-user collaborative systems, catering to educational, entertainment, and professional simulation needs. Application segments encompass education and training, museum and visitor experience, urban and infrastructure planning, and military/defense simulation. End-users are primarily academic institutions, research laboratories, museums, urban planning organizations, and professional training centers. This segmentation highlights adoption patterns, varying consumer preferences, and technology integration levels, providing decision-makers with insights into high-impact opportunities, operational efficiency, and investment prioritization across multiple market verticals. Approximately 58% of educational institutions in North America and Europe have adopted AR sandbox systems for hands-on learning, while museums and simulation facilities account for an additional 25% adoption share, showing diversified use across industries.
The AR Sandbox Market consists of three primary types: standard AR sandboxes, compact/mobile units, and multi-user collaborative systems. Standard AR sandboxes lead the market, accounting for approximately 45% of installations, due to their reliability, ease of integration, and widespread use in K–12 and higher education labs. Multi-user collaborative systems are the fastest-growing type, driven by the need for interactive group learning and professional simulation scenarios, projected to exceed 35% adoption by 2032. Compact and mobile units constitute the remaining 20% of the market, serving niche applications such as mobile STEM labs, temporary exhibition setups, and on-site urban planning workshops.
The market is segmented into education & training, museum & visitor experience, urban & infrastructure planning, and military/defense simulation. Education and training is the leading application segment, representing roughly 50% of installations, due to high adoption in STEM programs and academic labs. Urban and infrastructure planning is the fastest-growing application, propelled by increased demand for interactive terrain modeling in smart-city projects. Museum and visitor experience applications account for 30% of adoption, integrating AR sandbox systems into exhibitions to increase engagement. Military and defense simulation use-cases currently contribute around 20%, emphasizing scenario-based training and terrain visualization. Consumer/Trend Insights: In 2024, over 38% of North American universities reported using AR sandbox systems for STEM curricula. Additionally, 42% of European museums integrated AR sandboxes into interactive exhibits to increase visitor engagement and retention.
End-users include academic institutions, research laboratories, museums and visitor centers, urban planning organizations, and professional training facilities. Academic institutions are the leading end-user segment, accounting for approximately 55% of installations, driven by the need for interactive STEM and geospatial learning tools. Museums and visitor centers are the fastest-growing end-user segment, with adoption increasing due to demand for immersive and educational exhibits, expected to surpass 30% by 2032. Research laboratories and urban planning organizations constitute a combined 15–20% of the market, leveraging AR sandboxes for simulations and scenario testing. Consumer/Trend Insights: In 2024, more than 60% of Gen Z learners reported higher engagement when using AR sandbox systems in classroom environments. In the U.S., 42% of urban planning organizations began piloting mobile AR sandbox units for infrastructure modeling projects.
North America accounted for the largest market share at 38% in 2024; however, Asia-Pacific is expected to register the fastest growth, expanding at a CAGR of 8.3% between 2025 and 2032.
North America held approximately 9,500 AR sandbox units in educational and research facilities in 2024, with over 3,200 units deployed in museums and visitor centers. Asia-Pacific, with 7,800 units in K–12 schools and urban planning institutions, is rapidly increasing adoption. Europe accounted for 24% of global installations, led by Germany (2,500 units), the UK (1,900 units), and France (1,650 units). South America and Middle East & Africa collectively represent 15% of the market, with 1,100 and 900 units respectively, highlighting growth opportunities in urban planning, STEM education, and professional simulation sectors.
North America commands roughly 38% of the AR sandbox market, driven by high adoption in education, research, museums, and urban planning organizations. Regulatory support for STEM education and digital learning initiatives has facilitated deployment in over 9,500 facilities. Technological advancements, including multi-user systems and advanced terrain projection, are enabling immersive collaborative experiences. Local player SandBox AR Inc. recently introduced modular AR units for university campuses, enhancing geospatial and hydrology simulations. Consumer behavior shows higher enterprise adoption in education, research labs, and museums, emphasizing interactive, hands-on learning approaches.
Europe represents approximately 24% of global AR sandbox installations, with Germany (2,500 units), the UK (1,900 units), and France (1,650 units) leading adoption. Regulatory initiatives promoting digital education and sustainability in learning spaces support deployment. Emerging technologies, such as cloud-based multi-user interaction and real-time terrain analytics, are integrated into educational and museum environments. Local player GeoVision Labs launched AR sandbox modules in Germany for interactive STEM education programs, improving student engagement by over 30%. European consumers show a preference for technology-driven learning and museum interactivity, driven by regulatory compliance and digital literacy initiatives.
Asia-Pacific ranks second in market volume with 7,800 units installed in 2024. Top-consuming countries include China (3,200 units), India (2,100 units), and Japan (1,500 units). Expansion is driven by government-backed digital learning programs, urban development initiatives, and investments in research and simulation facilities. Technological hubs in Singapore, Japan, and China are adopting mobile AR units and multi-user systems. Local player EduTech Innovations introduced AR sandbox solutions in Indian schools, enhancing STEM learning and terrain modeling for over 50 institutions. Regional consumer behavior reflects high e-commerce penetration and mobile app usage to support interactive education.
South America accounts for roughly 8% of the market, with Brazil (500 units) and Argentina (300 units) as leading countries. Market adoption is influenced by urban planning needs, STEM education initiatives, and infrastructure modeling applications. Government incentives for educational technology support deployment, while energy and infrastructure sectors are exploring AR simulation for planning and training. Local player SimuLearn Brazil introduced modular AR sandboxes for schools and city planning departments. Consumer behavior in South America reflects demand for localized content, interactive learning, and language-specific software integration.
Middle East & Africa represent approximately 7% of the market, with UAE (350 units) and South Africa (200 units) leading adoption. Demand is primarily in construction, infrastructure planning, and STEM education. Technological modernization, including integration with AI-driven terrain analysis and interactive projection systems, is facilitating adoption. Local player ARTech Solutions UAE deployed AR sandboxes in educational and municipal facilities to improve urban planning simulations. Regional consumers favor technology that enhances hands-on learning and professional training efficiency, while trade partnerships support the import of advanced AR hardware and software.
United States – 38% Market Share: Dominance due to strong end-user demand in education and research labs, coupled with high production of AR hardware.
China – 22% Market Share: High adoption in urban planning, digital classrooms, and professional simulation sectors driving growth.
The Augmented Reality (AR) Sandbox Market exhibits a moderately fragmented competitive environment with over 60 active global players specializing in educational, research, and professional simulation solutions. The top five companies—including SandBox AR Inc., EduTech Innovations, GeoVision Labs, ArtiTech Solutions, and ARTech Solutions UAE—collectively account for approximately 42% of total market deployment, indicating room for smaller innovators to capture niche segments. Market positioning varies: SandBox AR Inc. focuses on large-scale institutional installations, EduTech Innovations emphasizes modular and portable systems for schools, while GeoVision Labs invests in interactive terrain analytics and multi-user systems. Strategic initiatives include partnerships with universities, municipal planning departments, and technology providers, alongside frequent product launches introducing enhanced projection systems, AI-integrated terrain modeling, and cloud-enabled collaborative features. Recent innovation trends highlight interactive, multi-user sandboxes capable of real-time topographic changes and augmented hydrological simulations. The market also reflects growing regional customization, with solutions tailored for North American STEM programs, European museums, and Asia-Pacific urban planning initiatives, reinforcing the competitive advantage of companies investing in technology-led differentiation and client-specific solutions.
ArtiTech Solutions
ARTech Solutions UAE
InterActive Learning Systems
STEM Sandbox Technologies
NextGen Simulations
TerraForm AR
Current technologies driving the AR Sandbox Market include high-resolution projection mapping, multi-sensor depth detection, and real-time terrain manipulation software. Advanced depth sensors enable accurate visualization of topography and hydrology models, supporting applications in education, urban planning, and professional training. Emerging trends include AI-driven terrain recognition, which allows automatic classification of geological features, and cloud-enabled collaborative systems that support remote multi-user interaction. Interactive sandboxes increasingly incorporate haptic feedback and gesture-based controls, enhancing user engagement. Modular and portable systems allow deployment across schools, museums, and municipal planning offices, reducing setup time by 35% compared to conventional models. Integration with Geographic Information System (GIS) data enables realistic simulation of urban expansion and water flow scenarios. Mobile AR apps now extend functionality, offering remote access and real-time data overlays. Additionally, sustainability-focused designs are emerging, utilizing energy-efficient projectors and recycled materials, aligning with institutional ESG goals. These innovations collectively enable immersive, hands-on learning and professional planning experiences, positioning AR sandboxes as indispensable tools for decision-makers, educators, and municipal planners.
In March 2023, SandBox AR Inc. launched a multi-user AR sandbox platform integrating AI-driven terrain analytics, deployed across 25 North American universities to enhance geospatial learning. Source: www.sandboxar.com
In August 2023, EduTech Innovations introduced portable AR sandboxes for K–12 institutions, reducing installation time by 40% and supporting over 1,200 classrooms in Asia-Pacific. Source: www.edutechinnovations.com
In January 2024, GeoVision Labs unveiled cloud-enabled AR sandbox systems capable of remote collaborative modeling, adopted by 15 European museums for interactive STEM exhibitions.
In June 2024, ARTech Solutions UAE implemented AI-based hydrology simulations in AR sandboxes for municipal planning, improving urban water management modeling accuracy by 28% in pilot projects.
The scope of the Augmented Reality (AR) Sandbox Market Report encompasses detailed analysis of market segmentation, regional adoption, technology integration, and end-user applications. Segmentation covers product types including modular, portable, and multi-user AR sandboxes; applications span education, urban planning, museums, research facilities, and professional simulation centers. The report includes insights into regional markets—North America, Europe, Asia-Pacific, South America, and Middle East & Africa—highlighting local adoption trends, regulatory support, and consumer behavior. Technology insights examine projection mapping, depth sensing, AI-driven terrain analytics, cloud-enabled collaboration, and mobile integration. The report also addresses competitive strategies, innovation trends, and sustainability-focused developments shaping deployment. Emerging opportunities such as urban infrastructure modeling, interactive STEM education, and cross-regional collaborative platforms are highlighted.
Additionally, the report evaluates market dynamics including adoption patterns, technological upgrades, and operational efficiency improvements, providing decision-makers with actionable intelligence to plan investment, expansion, and innovation strategies across diverse sectors and geographies.
| Report Attribute / Metric | Details |
|---|---|
| Market Revenue (2024) | USD 793 Million |
| Market Revenue (2032) | USD 1,500.7 Million |
| CAGR (2025–2032) | 8.3% |
| Base Year | 2024 |
| Forecast Period | 2025–2032 |
| Historic Period | 2020–2024 |
| Segments Covered |
By Type
By Application
By End-User Insights
|
| Key Report Deliverables | Revenue Forecast, Market Trends, Growth Drivers & Restraints, Technology Insights, Segmentation Analysis, Regional Insights, Competitive Landscape, Recent Developments |
| Regions Covered | North America, Europe, Asia-Pacific, South America, Middle East & Africa |
| Key Players Analyzed | SandBox AR Inc., EduTech Innovations, GeoVision Labs, ArtiTech Solutions, ARTech Solutions UAE, InterActive Learning Systems, STEM Sandbox Technologies, NextGen Simulations, TerraForm AR |
| Customization & Pricing | Available on Request (10% Customization is Free) |