Reports
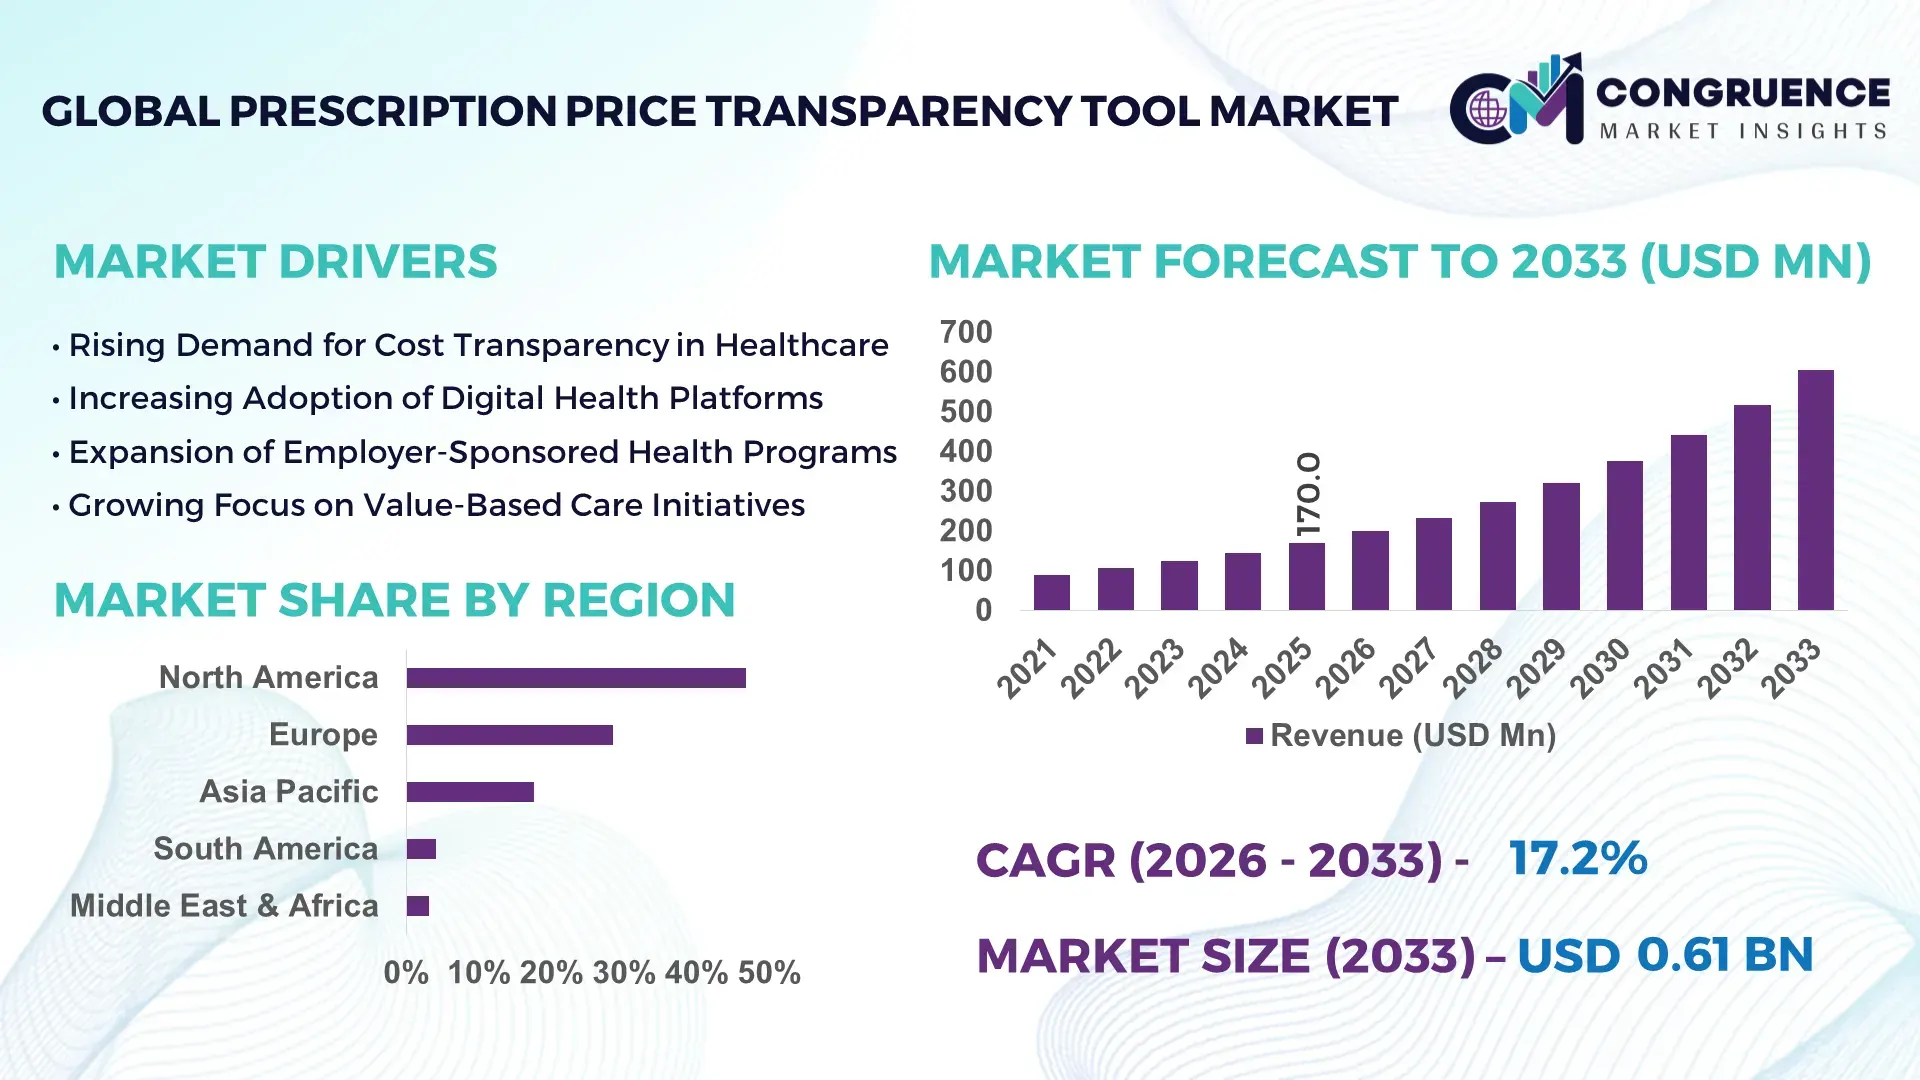
The Global Prescription Price Transparency Tool Market was valued at USD 170.0 Million in 2025 and is anticipated to reach a value of USD 605.2 Million by 2033 expanding at a CAGR of 17.2% between 2026 and 2033, according to an analysis by Congruence Market Insights. This growth is driven by escalating prescription drug costs and policy-led mandates requiring real-time visibility into drug pricing across healthcare ecosystems.
The United States dominates the Prescription Price Transparency Tool Market through extensive deployment across retail pharmacies, health insurers, and integrated delivery networks. Over 92% of large U.S. pharmacy benefit managers (PBMs) deploy digital price comparison platforms integrated with EHR and e-prescribing systems. Annual investments exceeding USD 2.5 billion are directed toward healthcare IT transparency solutions, with prescription pricing tools forming a core segment. More than 70 million consumers actively use pharmacy price comparison or transparency apps annually. The U.S. also leads in technological advancements such as AI-based formulary optimization, real-time benefit checks (RTBC), and API-driven interoperability under CMS rules, supporting nationwide scalability across Medicare, Medicaid, and employer-sponsored plans.
Market Size & Growth: USD 170.0 Million (2025) projected to USD 605.2 Million by 2033, growing at 17.2% CAGR, supported by regulatory enforcement of real-time drug pricing visibility.
Top Growth Drivers: Regulatory compliance adoption (68%), digital health platform integration (61%), consumer cost-awareness demand (57%).
Short-Term Forecast: By 2028, prescription cost out-of-pocket visibility is expected to improve by 35% across digital pharmacy channels.
Emerging Technologies: AI-driven price prediction engines, real-time benefit check APIs, blockchain-enabled pricing audit trails.
Regional Leaders: North America (USD 255 Million by 2033) with insurer-led tools; Europe (USD 175 Million) via public health integration; Asia Pacific (USD 110 Million) through mobile-first platforms.
Consumer/End-User Trends: Over 48% of insured patients actively compare drug prices before purchase; employer-sponsored plans show 52% tool utilization.
Pilot or Case Example: In 2024, a U.S. Medicare pilot reduced beneficiary prescription spending by 18% using RTBC-enabled transparency tools.
Competitive Landscape: OptumRx (~22% share) leads, followed by Change Healthcare, GoodRx, RxSaver, and CoverMyMeds.
Regulatory & ESG Impact: CMS Transparency in Coverage rules increased compliant deployments by 41% across payer networks.
Investment & Funding Patterns: Over USD 3.1 Billion invested globally since 2021, with strong venture funding in AI-based pricing analytics.
Innovation & Future Outlook: Deep EHR integration and predictive pricing intelligence are shaping next-generation platforms.
Prescription Price Transparency Tools are increasingly embedded across retail pharmacy, payer, employer, and digital health ecosystems, with PBMs contributing nearly 38% of platform deployments. Recent innovations include AI-based therapeutic substitution alerts and real-time formulary cost simulations. Regulatory pressure, rising drug inflation, and consumer price sensitivity are accelerating adoption, particularly in North America and Western Europe, while Asia Pacific shows strong mobile-driven growth momentum.
The Prescription Price Transparency Tool Market holds critical strategic relevance as healthcare systems globally confront rising pharmaceutical expenditures and affordability concerns. These tools enable payers, providers, and consumers to compare drug prices across pharmacies, insurance plans, and therapeutic alternatives, directly influencing cost containment strategies. AI-powered real-time benefit checks deliver 28% improvement in prescription decision accuracy compared to manual formulary checks, significantly reducing unexpected out-of-pocket expenses.
North America dominates in transaction volume due to large-scale payer integrations, while Europe leads in adoption intensity, with over 64% of public healthcare providers using centralized drug pricing visibility platforms. By 2028, AI-driven predictive pricing and therapeutic substitution engines are expected to reduce average prescription abandonment rates by 22%, improving adherence and health outcomes.
From a compliance perspective, firms are committing to transparency and governance improvements, including 100% digital auditability of pricing logic by 2030 under evolving CMS and EU HTA frameworks. In 2024, a U.S.-based insurer achieved a 19% reduction in member drug spend through AI-enabled price steering initiatives integrated into e-prescribing workflows.
Looking forward, the Prescription Price Transparency Tool Market is positioned as a foundational pillar supporting healthcare resilience, regulatory compliance, and sustainable cost optimization, with interoperability and AI intelligence defining future pathways.
The Prescription Price Transparency Tool Market is shaped by regulatory mandates, digital health transformation, and increasing consumer demand for cost visibility. Healthcare payers and providers are integrating transparency tools directly into clinical and pharmacy workflows to address drug affordability challenges. Interoperability standards such as FHIR and RTBC protocols are enabling seamless data exchange between EHRs, PBMs, and pharmacy networks. Simultaneously, employers and government programs are leveraging these tools to optimize formulary design and steer utilization toward cost-effective therapies. The market is also influenced by rising specialty drug usage, which now accounts for over 50% of total drug spending, intensifying the need for real-time pricing intelligence.
Regulatory mandates such as CMS Transparency in Coverage and real-time benefit check requirements are accelerating adoption of prescription price transparency tools. In the U.S., over 85% of Medicare Part D plans are required to provide real-time cost estimates during prescribing. Similar frameworks in Europe mandate public disclosure of reimbursed drug prices. These policies are compelling healthcare stakeholders to deploy compliant digital platforms, improving price predictability and reducing billing disputes. As compliance deadlines tighten, adoption across insurers, pharmacies, and providers continues to expand rapidly.
Despite strong demand, inconsistent data standards and fragmented pricing structures pose challenges. Drug prices vary by payer contracts, rebates, and regional agreements, creating complexity in delivering accurate real-time information. Over 40% of healthcare organizations report integration delays due to legacy IT systems. Additionally, proprietary PBM pricing models limit transparency depth, restraining full-scale deployment across smaller providers and emerging markets.
AI-enabled predictive pricing presents significant opportunities by forecasting patient-specific out-of-pocket costs and suggesting lower-cost therapeutic alternatives. Advanced platforms can now simulate formulary changes with up to 30% improvement in cost optimization outcomes. Employers and value-based care organizations increasingly adopt these tools to manage drug spend proactively, creating new growth avenues across enterprise and population health applications.
Prescription pricing platforms handle sensitive patient and financial data, increasing exposure to cybersecurity risks. Compliance with HIPAA, GDPR, and regional data protection laws requires continuous investment. Cybersecurity spending among healthcare IT vendors has increased by 26% over the past three years, impacting operating margins and slowing deployment timelines, particularly for smaller solution providers.
Expansion of Real-Time Benefit Check Integration: Over 72% of U.S. e-prescribing platforms now embed RTBC functionality, reducing prescription rework rates by 31% and improving first-fill success.
AI-Driven Therapeutic Substitution Engines: AI-based systems analyzing formularies and clinical equivalence have increased lower-cost drug selection by 27%, particularly in chronic disease management.
Mobile-First Consumer Transparency Platforms: Mobile pharmacy price comparison apps report 48% year-on-year increase in active users, with digital coupons reducing consumer spend by 15–20% per prescription.
Employer-Sponsored Cost Steering Programs: Large employers adopting transparency tools achieved 21% reduction in annual pharmacy benefit costs, supported by employee engagement rates exceeding 60%.
The Prescription Price Transparency Tool Market is segmented by type, application, and end-user, reflecting how pricing intelligence is generated, deployed, and consumed across the healthcare ecosystem. By type, solutions range from real-time benefit check platforms to consumer-facing price comparison tools and advanced analytics engines, each addressing different transparency needs. Applications span payer-driven cost optimization, provider decision support, pharmacy price comparison, and employer-sponsored benefit management. End-user adoption varies significantly across pharmacy benefit managers, healthcare providers, payers, employers, and consumers, shaped by regulatory exposure, scale of prescription volume, and digital maturity. Increasing integration with EHR systems, rising specialty drug utilization exceeding 50% of total prescriptions, and growing patient cost sensitivity are collectively reshaping segmentation dynamics, with enterprise-grade platforms and payer-led deployments gaining prominence over standalone consumer tools.
The market by type includes Real-Time Benefit Check (RTBC) Tools, Consumer Price Comparison Platforms, Payer & PBM Analytics Dashboards, and Employer-Sponsored Transparency Solutions.
RTBC tools lead the segment, accounting for approximately 41% of total adoption, as they are embedded directly into e-prescribing and EHR workflows, enabling clinicians to view patient-specific out-of-pocket costs at the point of care. Their leadership is supported by regulatory requirements mandating real-time pricing visibility during prescribing.
Consumer price comparison platforms hold around 26% share, driven by mobile app usage and pharmacy coupon integrations. However, payer and PBM analytics platforms represent the fastest-growing type, expanding at an estimated 19.4% CAGR, fueled by insurers’ need to manage specialty drug spend, simulate formulary scenarios, and reduce prescription abandonment.
Employer-sponsored transparency tools and niche API-based pricing engines collectively account for the remaining 33% share, serving targeted use cases such as self-funded employer plans and digital health startups.
In 2025, a national Medicare program deployed RTBC tools across over 60,000 prescribing clinicians, reducing prescription rework events by more than 30% and improving first-fill success rates.
By application, the market is segmented into Clinical Decision Support, Pharmacy Price Comparison, Payer Cost Management, and Employer & Population Health Programs.
Clinical decision support is the leading application, representing nearly 38% of usage, as transparency tools increasingly guide prescribers toward lower-cost therapeutic alternatives without compromising clinical efficacy. Pharmacy price comparison applications follow with 27% share, largely driven by consumer-facing mobile platforms.
Payer cost management applications are the fastest-growing, with an estimated 18.6% CAGR, supported by rising specialty drug claims and value-based reimbursement models that demand predictive pricing intelligence. Employer and population health applications contribute the remaining 35% combined share, focusing on benefit optimization and workforce cost containment.
Consumer adoption trends reinforce this segmentation. In 2025, 46% of insured patients reported checking drug prices digitally before filling prescriptions, while over 52% of large employers integrated transparency tools into their pharmacy benefit strategies.
In 2024, a national public health system implemented pharmacy price comparison tools across hospital outpatient pharmacies, enabling more than 5 million patients to access same-day lower-cost alternatives.
End-user segmentation includes Pharmacy Benefit Managers (PBMs) & Payers, Healthcare Providers, Employers, and Individual Consumers.
PBMs and payers dominate end-user adoption with approximately 44% share, reflecting their central role in formulary design, rebate management, and pricing negotiations. Providers account for 24%, primarily through EHR-integrated transparency tools that support prescribing decisions.
Employers represent the fastest-growing end-user group, expanding at an estimated 20.1% CAGR, driven by the rise of self-funded health plans and increasing focus on prescription cost control. Individual consumers and digital health platforms collectively contribute the remaining 32% share, supported by mobile-first engagement and pharmacy app ecosystems.
Adoption metrics highlight strong momentum: in 2025, over 58% of large healthcare providers reported active use of prescription transparency tools, while nearly 49% of employees enrolled in self-funded plans accessed pricing tools at least once annually.
In 2025, a Fortune 500 employer deployed a prescription transparency platform across its workforce, achieving a measurable 17% reduction in high-cost brand drug utilization within one year.
North America accounted for the largest market share at 46.8% in 2025 however, Asia-Pacific is expected to register the fastest growth, expanding at a CAGR of 19.1% between 2026 and 2033.
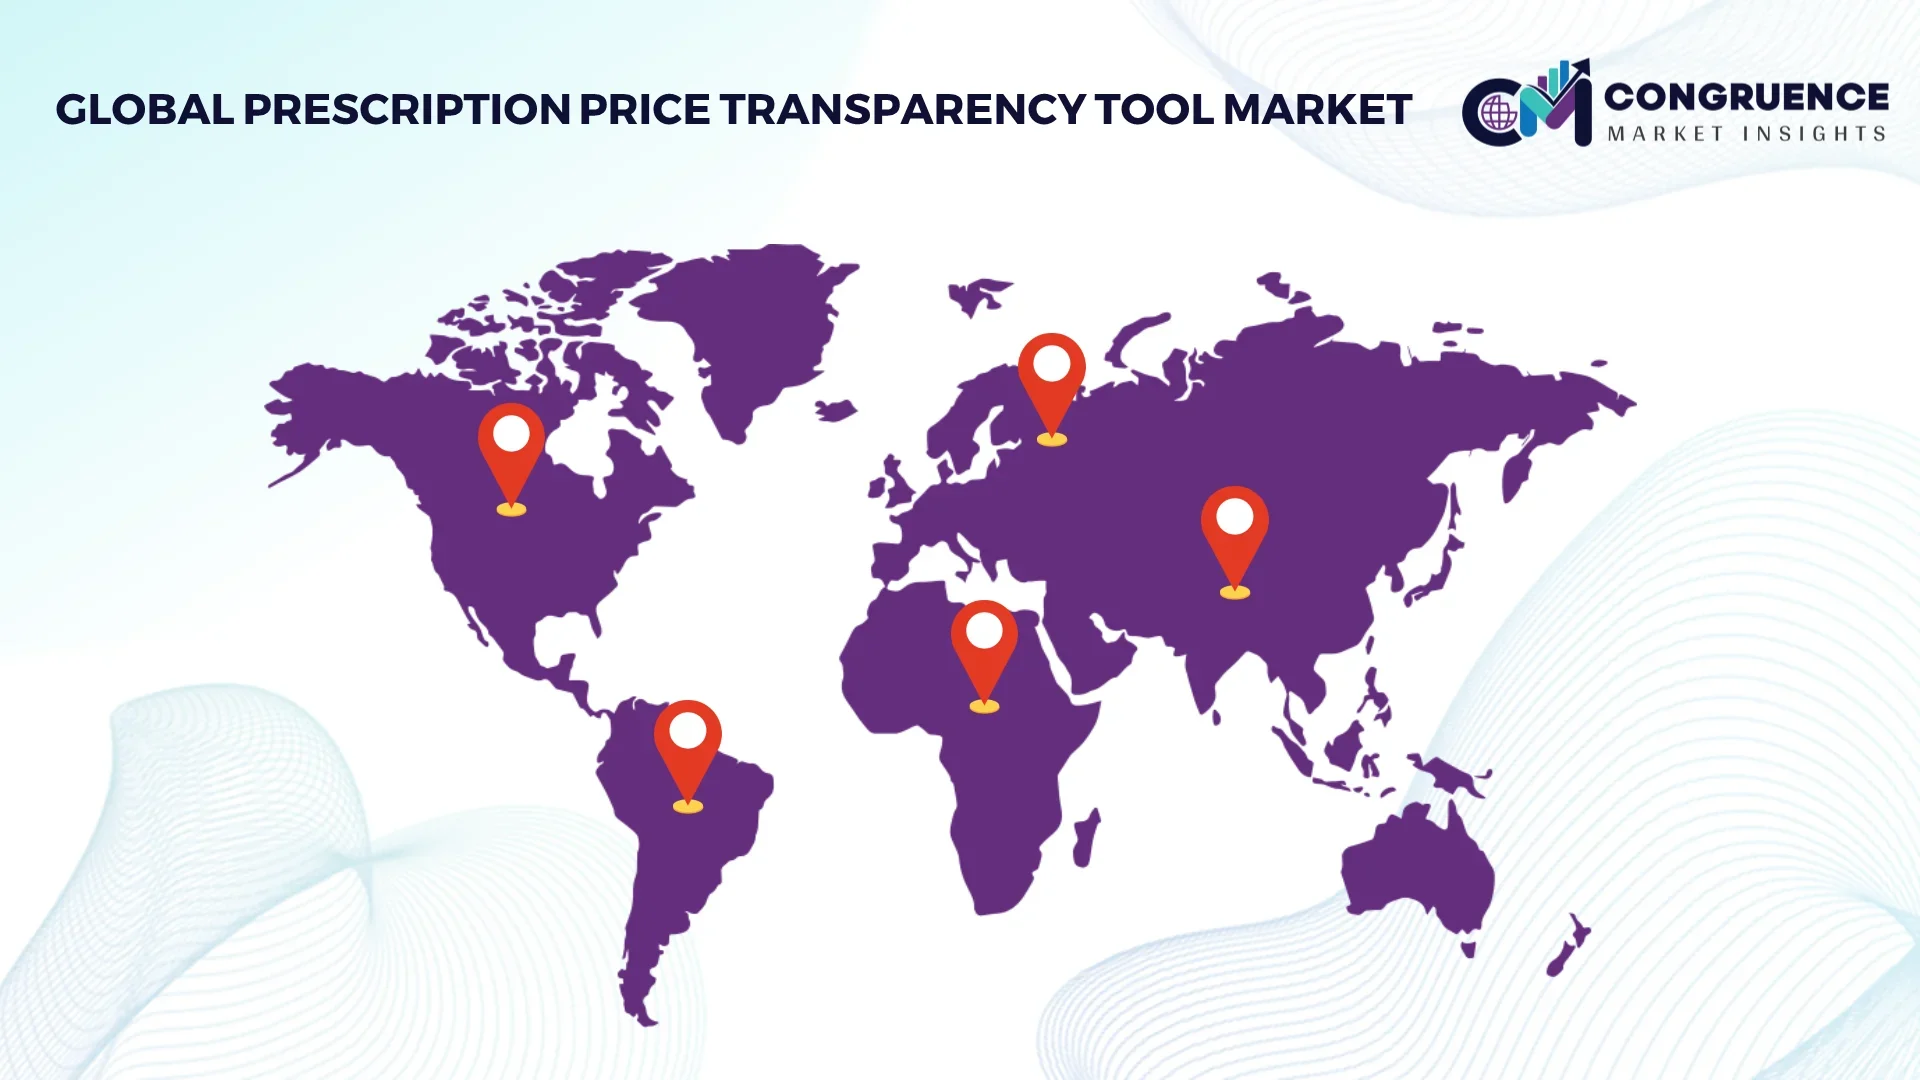
North America’s dominance is supported by high digital health penetration, with over 85% of large healthcare payers integrating prescription price transparency tools into their workflows and more than 70 million active users accessing pricing comparison platforms annually. Europe follows with approximately 28.4% share, driven by regulatory enforcement across public healthcare systems in Germany, the UK, and France. Asia-Pacific currently holds around 17.6% share, but rapid mobile health adoption, rising out-of-pocket spending, and government-backed digital health programs across China, India, and Japan are accelerating uptake. South America and the Middle East & Africa together account for roughly 7.2% share, supported by gradual healthcare digitization and policy-led transparency initiatives.
North America represents approximately 46.8% of the global Prescription Price Transparency Tool Market, making it the largest regional contributor. Demand is driven primarily by healthcare payers, PBMs, integrated delivery networks, and large employers managing self-funded health plans. Regulatory initiatives such as real-time benefit checks and transparency-in-coverage requirements have resulted in over 90% of Medicare Part D plans deploying digital pricing visibility tools. Technological advancement is strong, with widespread use of AI-driven formulary intelligence, API-based EHR integration, and predictive cost modeling. Local players such as GoodRx and OptumRx are expanding functionality by embedding price comparison directly into prescribing platforms. Consumer behavior reflects high digital maturity, with over 60% of insured patients checking prescription prices online before pharmacy visits, reinforcing sustained regional demand.
Europe accounts for approximately 28.4% of global market share, supported by centralized healthcare systems and strong regulatory oversight. Key markets include Germany, the United Kingdom, and France, which together represent more than 65% of regional adoption. Regulatory bodies enforce standardized drug pricing disclosure across public reimbursement systems, driving adoption of explainable and auditable transparency platforms. Emerging technologies such as interoperable pricing registries and AI-supported substitution alerts are gaining traction. Local digital health vendors are partnering with national health services to integrate pharmacy pricing into patient portals. Consumer behavior in Europe is shaped by regulatory pressure, with over 55% of patients relying on government-backed platforms rather than standalone commercial apps for drug price information.
Asia-Pacific ranks as the fastest-expanding region, currently contributing around 17.6% of global market volume. Leading countries include China, India, and Japan, collectively accounting for over 70% of regional demand. Growth is supported by rapid expansion of digital health infrastructure, national e-health missions, and rising out-of-pocket prescription spending exceeding 45% in several emerging economies. Innovation hubs in India and Singapore are developing mobile-native pricing tools integrated with telemedicine platforms. Local startups are leveraging AI to compare branded versus generic drug costs across urban and semi-urban pharmacies. Consumer behavior is distinctly mobile-driven, with more than 68% of users accessing prescription pricing tools via smartphones.
South America holds approximately 4.1% of the global market, with Brazil and Argentina as the leading countries. Government-led healthcare digitization programs and expansion of public pharmacy networks are increasing demand for transparency tools. Infrastructure improvements in national e-health systems and cross-border pharmaceutical trade agreements support gradual adoption. Local health-tech firms are developing multilingual pricing platforms tailored to public insurance beneficiaries. Consumer behavior reflects rising awareness, with around 40% of urban patients in major cities using digital channels to compare prescription prices, particularly for chronic disease medications.
The Middle East & Africa region accounts for roughly 3.1% of global share, with UAE and South Africa emerging as key growth countries. Demand is driven by healthcare modernization initiatives, private insurance expansion, and digital hospital infrastructure projects. Governments are promoting health IT adoption through public–private partnerships and cross-border trade collaborations. Regional platforms focus on integrating pricing transparency within hospital management systems rather than standalone consumer apps. Consumer behavior varies widely, but in urban centers, over 35% of insured patients actively seek digital prescription price information prior to purchase.
United States – 42.5% Market Share: Strong regulatory enforcement, high PBM penetration, and widespread EHR-integrated pricing tools drive dominance.
Germany – 9.6% Market Share: Centralized public healthcare pricing systems and mandatory reimbursement transparency support extensive adoption.
The competitive environment in the Prescription Price Transparency Tool Market is moderately fragmented to consolidating, with dozens of active competitors including tech vendors, PBM-focused analytics providers, and consumer-facing platforms. Industry players range from specialized startups to established healthcare IT firms, and many participants are expanding through strategic partnerships, product innovation, and ecosystem integration. The combined share of the top 5 companies—including GoodRx, Surescripts, RxSense, Truveris, and CoverMyMeds—is estimated at approximately 41–47%, reflecting both concentration among leading incumbents and a broad array of mid-tier players driving niche segments.
Competitive dynamics are shaped by a race to develop real-time prescribing price engines, interoperability tools, and AI-augmented benefit insight systems that embed cost visibility into EHR, pharmacy, and payer workflows. Many companies are aligning with PBMs and health plans to ensure broad data access and deployment scale. For example, Surescripts’ health intelligence network processed tens of billions of clinical and benefit transactions in 2024, enabling interoperable cost visibility across major U.S. provider systems.
Strategic initiatives include partnerships—such as the Surescripts-GoodRx alliance to launch the Script Corner transparency product that gives providers and patients personalized cost information at the point of prescribing. Established healthcare IT giants and EHR vendors are also incorporating transparency modules into larger suites, increasing competitive pressure on standalone tools. The innovation trend emphasizes seamless interoperability, patient-centric interfaces, and advanced analytics to inform prescribers and consumers alike, making technology differentiation central to competitive positioning.
Truveris
CoverMyMeds
MedImpact
Change Healthcare
Epic Systems
Cerner Corporation / Oracle Health
Rx Savings Solutions
Allscripts
eClinicalWorks
NextGen Healthcare
Benefitfocus
The Prescription Price Transparency Tool Market is undergoing rapid transformation through advanced technology integration, elevating how pricing data is captured, analyzed, and delivered to stakeholders. Interoperability standards such as FHIR and real-time benefit APIs enable seamless connections between EHRs, PBMs, pharmacies, and payers, ensuring clinicians and patients can access accurate cost and coverage information at the point of decision-making. Enhanced machine learning and AI algorithms are powering predictive pricing insights that consider formulary nuances, rebate dynamics, and patient-specific benefit data, enabling providers to forecast out-of-pocket costs and alternative therapies more precisely.
Cloud-native analytics platforms are increasingly common, supporting scalability and rapid updates to pricing rule logic without significant on-premise overhead. These systems can process large volumes of claims, rebate, and pricing data from disparate sources—fueling more responsive cost transparency dashboards and embedded decision-support tools. Additionally, mobile and web-first user experiences are expanding patient access, reducing barriers for individuals seeking to compare drug prices across retail and mail-order pharmacies.
Another emerging technology trend is the use of API-driven prior authorization automation which integrates transparency data with automated workflow engines; this reduces administrative burden and accelerates prescriber access to cost information. Blockchain techniques are also being tested to ensure traceability and immutable pricing logs, which can enhance trust between stakeholders. Data visualization innovations are enabling richer, more instinctive views of pricing variation by pharmacy, region, and benefit design. As regulatory frameworks evolve to mandate greater transparency and interoperability, technologies that can adapt quickly and securely to new compliance requirements are becoming strategic differentiators in the marketplace.
• In January 2026, Surescripts and GoodRx launched the Script Corner price transparency platform, enabling patients to receive personalized prescription cost visibility—including insurance copays and GoodRx discounted cash prices—via secure mobile links immediately after e-prescribing, enhancing affordability and choice at the point of care. Source: www.surescripts.com
• In late 2025, the U.S. Department of Health and Human Services finalized a rule requiring certified health IT systems to provide real-time access to prescription drug pricing and out-of-pocket cost information, enabling providers to more efficiently compare therapeutic options and streamline prior authorization workflows. Source: www.hhs.gov
• In January–June 2025, GoodRx reported growth in prescription transaction revenue to $148.9 million, reflecting its expanded role in consumer price comparison and discount program usage even as overall macro pricing pressures persisted. Source: www.goodrx.com
• In 2024, Surescripts’ 2024 Annual Impact Report showed over 27.2 billion network transactions, including benefit and formulary data exchanges that facilitate price transparency and clinical decision support across major EHRs, reflecting broad ecosystem adoption of integrated pricing intelligence. Source: www.surescripts.com
The scope of the Prescription Price Transparency Tool Market Report encompasses a comprehensive examination of solution types, application areas, geographic distribution, technology integration, and competitive dynamics. It systematically analyzes how various tool types, including real-time benefit check platforms, consumer price comparison engines, enterprise analytics dashboards, and integrated provider decision-support modules, address distinct stakeholder needs across healthcare delivery and payment systems. The report covers application domains such as clinical prescribing support, payer cost optimization, pharmacy price comparison, and employer benefit management, reflecting the diverse use cases that drive demand for transparent pricing insights.
Geographically, the report evaluates regional market landscapes across North America, Europe, Asia-Pacific, South America, and the Middle East & Africa, detailing deployment patterns, regulatory influences, and technology adoption trends unique to each region. It also highlights end-user segments including pharmacy benefit managers, healthcare providers, payers, employers, and individual patients—each with differentiated requirements and usage behavior. The technology section interrogates current and emerging innovations like interoperability protocols, cloud-native architectures, AI-driven analytics, API-based integration, mobile accessibility, and blockchain’s role in secure data exchange. Attention is given to industry focus areas, such as improving medication adherence through transparent cost insights, reducing administrative burden via automated prior authorization, and enhancing decision-making at the point of care. Emerging or niche segments, such as mobile first transparency apps in emerging markets and patient engagement tools for high-deductible health plans, are also covered. Together, this scope delivers a holistic, business-oriented overview tailored for decision-makers aiming to understand market breadth, evolving technology imperatives, and strategic competitive pressures.
| Report Attribute / Metric | Details |
|---|---|
| Market Revenue (2025) | USD 170.0 Million |
| Market Revenue (2033) | USD 605.2 Million |
| CAGR (2026–2033) | 17.2% |
| Base Year | 2025 |
| Forecast Period | 2026–2033 |
| Historic Period | 2021–2025 |
| Segments Covered |
By Type
By Application
By End-User Insights
|
| Key Report Deliverables | Revenue Forecast, Market Trends, Growth Drivers & Restraints, Technology Insights, Segmentation Analysis, Regional Insights, Competitive Landscape, Regulatory & ESG Overview, Recent Developments |
| Regions Covered | North America, Europe, Asia-Pacific, South America, Middle East & Africa |
| Key Players Analyzed | GoodRx, Surescripts, RxSense, Truveris, CoverMyMeds, MedImpact, Change Healthcare, Epic Systems, Oracle Health (Cerner), Rx Savings Solutions, Allscripts, eClinicalWorks, NextGen Healthcare, Benefitfocus |
| Customization & Pricing | Available on Request (10% Customization Free) |