
Reports
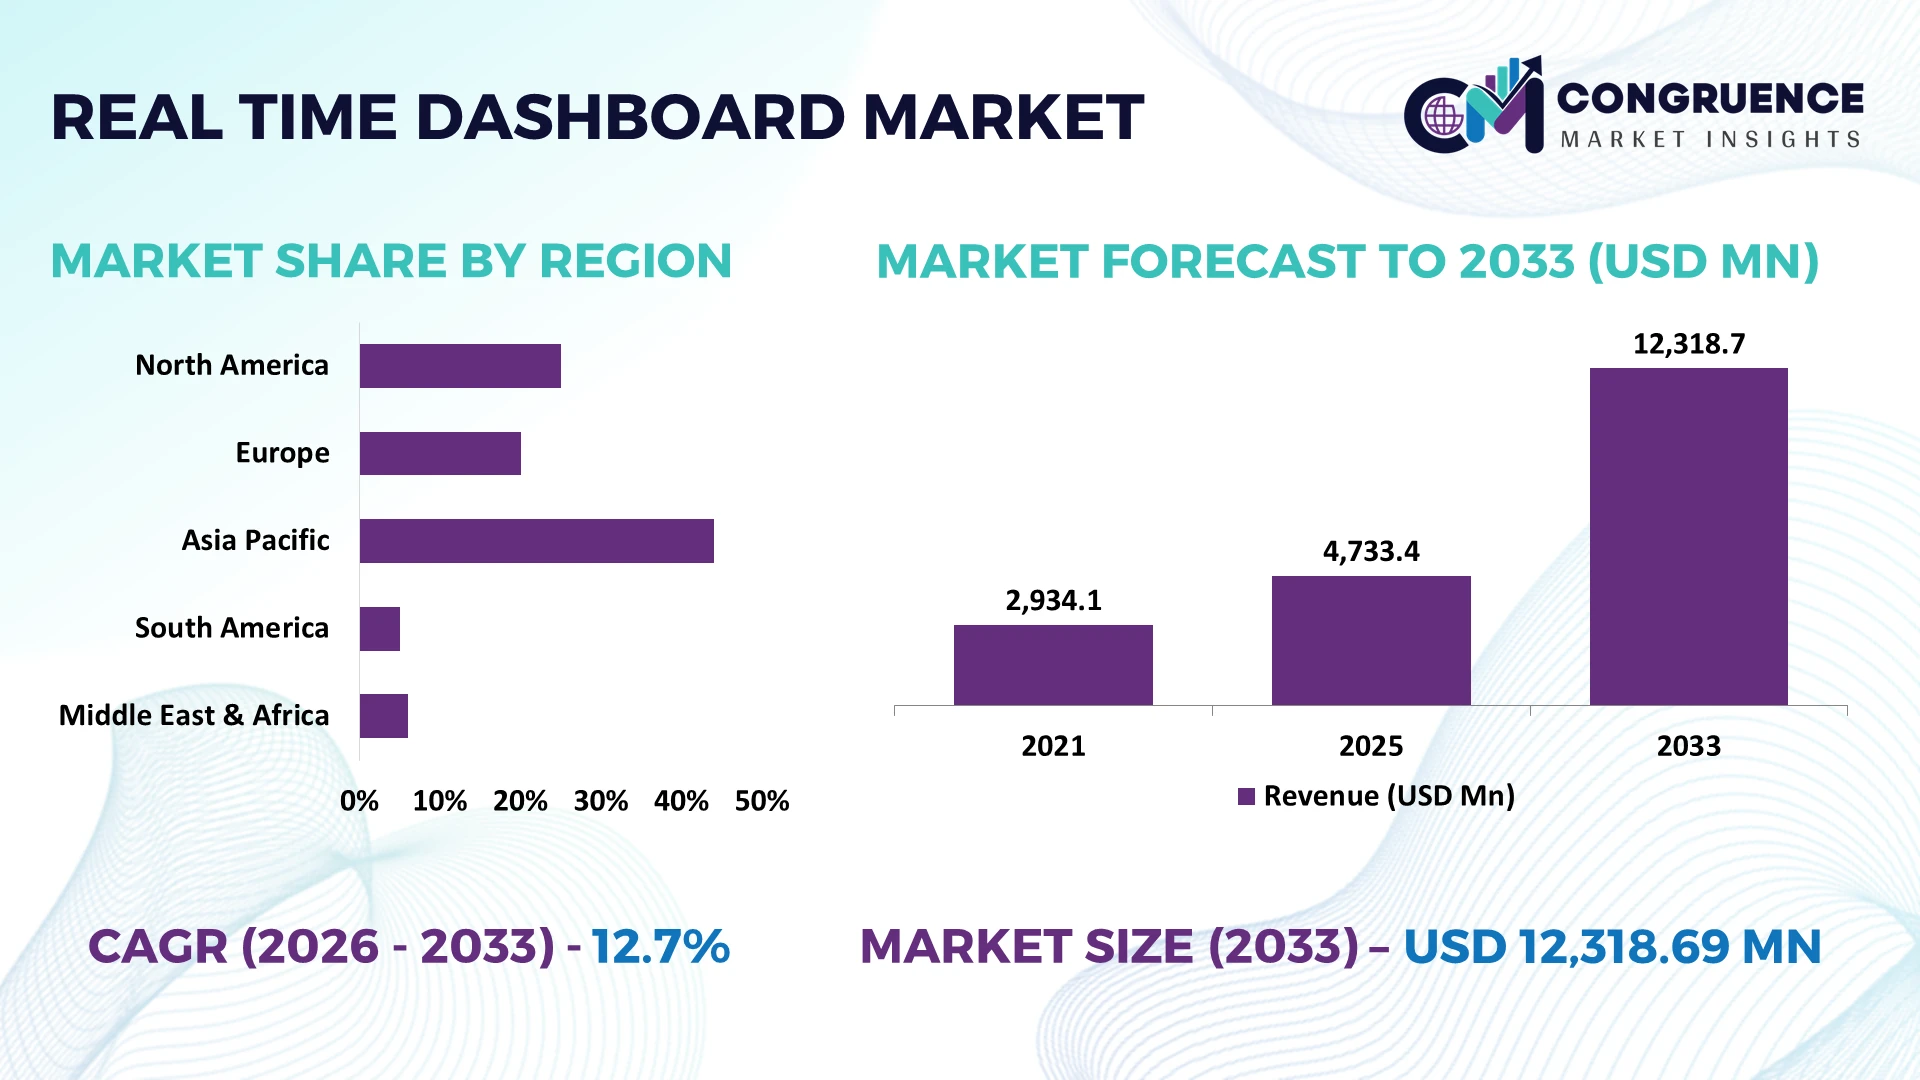
The Global Real-time Dashboard Market was valued at USD 4733.4 Million in 2025 and is anticipated to reach a value of USD 12318.69 Million by 2033 expanding at a CAGR of 12.7% between 2026 and 2033. Growth is driven by streaming data architectures, cloud data warehouses, AI assisted analytics, operational observability, and enterprise demand for continuously refreshed decision intelligence.
The United States dominates deployment through hyperscale cloud infrastructure, mature enterprise software spending, and concentrated adoption across finance, retail, manufacturing, healthcare, and technology. Cloud services are used by more than 90% of large US enterprises, while Microsoft invested USD 80 billion in AI enabled data centers during fiscal 2025. China provides the strongest scale comparison through rapid domestic cloud and industrial digitalization investment. US restrictions on advanced semiconductor exports to China are simultaneously reinforcing geographically separated analytics infrastructure and sovereign data architectures.
Enterprises should prioritize dashboard platforms combining streaming ingestion, governed semantic layers, AI interpretation, and cloud portability rather than isolated visualization functionality.
Market Size & Growth: USD 4,733.4 million in 2025 reaches USD 12,318.69 million by 2033 at 12.7% CAGR, driven by streaming analytics and cloud modernization.
Top Growth Drivers: Cloud adoption above 90%, AI deployment reaching 78%, and data driven decision adoption above 70% accelerate real time visualization requirements.
Short Term Forecast: By 2028, AI assisted dashboard workflows will reduce routine analytical preparation time by 30%, redirecting analysts toward exception handling and decision support.
Emerging Technologies: Generative AI, natural language querying, and stream processing increasingly converge across 3 layers: data ingestion, automated interpretation, and visualization.
Regional Leaders: North America approaches USD 4.4 billion, Europe USD 3.1 billion, and Asia Pacific USD 3.6 billion by 2033 as cloud native analytics deployment expands.
End User Trends: 78% of organizations reported using AI in at least one business function, increasing demand for continuously refreshed operational and model performance dashboards.
Pilot Case Example: In 2025, Microsoft Fabric Real Time Intelligence consolidated event streams and analytics within 1 environment, reducing dependence on separate monitoring workflows.
Competitive Landscape: Microsoft holds an estimated 20% analytics platform position, competing with Salesforce, Google, Amazon Web Services, and Qlik across enterprise visualization and intelligence.
Regulatory & ESG Impact: EU AI Act penalties reach 7% of worldwide annual turnover for specified violations, increasing demand for governed monitoring and compliance dashboards.
Investment & Funding: Microsoft’s USD 80 billion fiscal 2025 AI infrastructure investment expands the computing foundation supporting advanced analytics, visualization, and intelligent enterprise applications.
Innovation & Future Outlook: Subsecond streaming, autonomous agents, and multimodal analytics are shifting dashboards from 1 way visualization toward continuous decision and action orchestration.
The Real-time Dashboard Market is evolving from static business intelligence interfaces toward continuously updated operational control layers spanning finance, supply chains, manufacturing, cybersecurity, customer operations, and cloud infrastructure. Stream processing, natural language analytics, embedded AI, and automated anomaly detection increasingly convert live event data into prioritized actions. With 78% of organizations using AI in at least one business function, dashboard architectures must handle both human and machine generated decisions. Data sovereignty requirements and fragmented global cloud infrastructure are also strengthening governed deployment models, setting the foundation for the market’s strategic evolution.
Real time dashboards are becoming strategic operating infrastructure as enterprises move decisions from scheduled reporting toward event driven management. More than 50% of enterprise managed data is now processed outside traditional data centers, increasing the importance of unified visibility across cloud, edge, factory, logistics, and customer systems. Infrastructure modernization is therefore shifting investment toward streaming architectures that connect operational events directly with decision workflows.
Modern stream processing can expose events within seconds, versus legacy batch reporting cycles commonly measured in hours, cutting information latency by more than 90%. US enterprises emphasize cloud scale and AI integration, while German manufacturers prioritize industrial telemetry and production visibility. Through 2028, enterprises will increasingly connect dashboards with predictive models, automated alerts, and workflow triggers rather than expanding visualization layers independently.
A manufacturer can stream machine condition, throughput, quality, and energy signals into one operations dashboard, allowing supervisors to intervene before production exceptions propagate. Vendors are consequently investing in semantic models, event processing, embedded analytics, and ecosystem integrations. Competitive advantage will belong to platforms that convert live data into governed operational action with minimal analytical delay.
Enterprise operations increasingly generate continuously changing data that loses decision value when trapped in scheduled reports. Manufacturing facilities can produce thousands of sensor events per second, while modern streaming engines process events with subsecond latency and reduce decision delays by more than 90% compared with hourly batch refreshes. In the United States, manufacturers are connecting industrial IoT telemetry with production, maintenance, and quality dashboards as factories digitize control environments. This shift turns visualization into an operational interface rather than retrospective reporting. Platform providers are expanding event streaming connectors, edge ingestion, alert automation, and embedded analytics partnerships. The strategic advantage is response compression: organizations identifying production deviations within seconds can contain quality losses before they accumulate across an entire shift.
Real time visibility becomes expensive when enterprises operate fragmented ERP, CRM, industrial, cloud, and legacy databases with incompatible schemas and refresh patterns. Large organizations commonly manage more than 1,000 applications, while poor data quality can consume 20% or more of analytical team capacity through reconciliation and correction. Germany’s industrial base illustrates the integration burden because modern cloud analytics frequently must coexist with decades old operational technology. High frequency queries also increase compute and data movement costs when dashboards are poorly architected. Enterprises are responding through semantic layers, data virtualization, standardized APIs, caching, and workload tiering. The critical constraint is architectural rather than visual: adding dashboards without rationalizing upstream data pipelines multiplies synchronization expense and undermines trust in supposedly real time metrics.
Agentic analytics creates a new commercial layer by allowing dashboards to detect exceptions, explain causes, recommend responses, and initiate approved workflows. Generative AI adoption has reached 71% among organizations using AI, while natural language interfaces can reduce routine query construction time by more than 30%. Singapore provides a strong deployment environment through digitally mature banking, logistics, government, and infrastructure operations. The next opportunity is not additional charts but closed loop decision systems linking live metrics with enterprise agents, forecasting models, and workflow automation. Vendors are investing in conversational analytics, retrieval augmented generation, autonomous alert triage, and application integrations. By 2028, platforms combining governed data semantics with action capable agents will capture higher strategic value because customers can automate operational responses without replacing underlying transactional systems.
Scaling dashboards from departmental monitoring to enterprise control introduces concurrency, latency, resilience, and security challenges that conventional business intelligence architectures were not designed to manage. Mission critical applications increasingly target 99.99% availability, permitting only about 53 minutes of annual downtime, while subsecond dashboard requirements intensify pressure on databases, networks, and streaming infrastructure. Japan’s manufacturing and transportation environments demonstrate why delayed or duplicated telemetry can compromise operational decisions even when visualizations remain available. Cybersecurity also becomes more consequential as live dashboards expose consolidated operational information and privileged actions. Providers must invest in distributed caching, observability, failover architecture, granular access controls, and automated data validation. Long term leadership depends on maintaining trustworthy metrics during traffic spikes, infrastructure failures, and rapidly changing data states rather than merely delivering faster refresh rates.
Edge Dashboards Move Closer Operations: Industrial dashboards are shifting processing toward factories, warehouses, and distributed assets where network latency limits centralized monitoring. Edge architectures can cut telemetry response times by 50% or more and maintain visualization during connectivity interruptions. Manufacturers are deploying local gateways, cached metrics, and synchronized cloud views. Vendors are expanding edge connectors and lightweight runtimes, giving operators faster exception visibility without continuously transmitting every raw event.
Observability Converges With Business Metrics: Enterprises increasingly combine application health, infrastructure telemetry, and commercial KPIs within unified dashboard environments. Modern observability estates can ingest millions of events per minute while consolidating 3 core telemetry classes: metrics, logs, and traces. Technology teams are linking service outages directly with transaction and customer impact. Platform suppliers are expanding OpenTelemetry compatibility and cross platform integrations, reducing monitoring fragmentation and accelerating incident prioritization.
Mobile Command Views Gain Precision: Executives and field managers increasingly require live operational visibility outside desktop environments. Smartphone optimized dashboards now emphasize fewer than 10 priority indicators per view, push alerts, responsive layouts, and role based access. Logistics and retail operators are extending mobile monitoring across fleets, stores, and distribution facilities. Providers are redesigning interfaces around exception based workflows, improving decision speed while reducing dependence on centralized control rooms.
Governance Enters Dashboard Design: Expanding regulatory scrutiny is embedding lineage, permissions, metric definitions, and auditability directly into analytics workflows. EU digital governance requirements increase accountability for automated decisions, while enterprise data estates can contain thousands of duplicated metrics. Companies are implementing certified KPI catalogs and row level security. Vendors are integrating governance metadata into dashboards, reducing conflicting calculations and giving regulated users traceable decision context.
Operational Dashboards lead with an estimated 32% share, reflecting their continuous use across production, service delivery, transactions, logistics, and infrastructure monitoring. Their advantage comes from frequent refresh cycles, alert driven workflows, and integration with transactional systems. Analytical Dashboards remain important for deeper investigation, while Strategic Dashboards consolidate longer horizon business indicators. Executive Dashboards emphasize condensed enterprise visibility and typically restrict interfaces to fewer high priority measures for faster interpretation.
Embedded Dashboards are the fastest growing type as analytics increasingly moves directly into CRM, ERP, SaaS, and customer facing applications. Embedding can increase analytics engagement by 20% or more by eliminating application switching. Mobile Dashboards strengthen field and executive access, particularly where operational decisions occur away from workstations. Providers are expanding software development kits, white label interfaces, APIs, and responsive visualization components. Investment is therefore moving from standalone dashboard destinations toward contextual analytics delivered inside existing workflows, giving application vendors stronger user retention and differentiated digital products.
KPI Monitoring represents the leading application with an estimated 28% share because enterprises require consistent visibility into service levels, productivity, utilization, conversion, and operational targets. Performance Tracking extends this framework toward teams and assets, while Sales Analytics connects pipeline movement with customer activity. Financial Monitoring remains essential for liquidity, expenditure, margin, and budget control, particularly where managers require daily rather than monthly visibility.
Risk Monitoring is the fastest growing application as cyber threats, fraud exposure, compliance events, and third party dependencies require continuous surveillance. Organizations can track hundreds of risk indicators simultaneously, while automated thresholding can shorten exception identification by more than 40% compared with manual review cycles. Operations Monitoring remains critical in factories and digital infrastructure, whereas Customer Analytics increasingly combines journey and service indicators. Dashboard vendors are expanding anomaly detection, configurable alerts, role specific templates, and data connectors. Competitive advantage increasingly depends on translating specialized application data into prioritized exceptions rather than presenting identical visualization functionality across departments.
Banking leads end user adoption with an estimated 24% share because payments, liquidity, fraud, customer activity, branch performance, and digital services require continuous visibility. Large institutions process millions of transactions daily, making automated metric refresh and exception escalation operational necessities. Telecommunications similarly relies on live network and subscriber monitoring, while Retail connects dashboards with inventory, stores, ecommerce, and customer activity. IT Services uses real time views for service delivery, infrastructure health, and client commitments.
Manufacturing is the fastest growing end user as connected machinery, industrial sensors, quality systems, and energy monitoring generate continuous production data. Smart factory deployments can connect thousands of equipment signals, pushing manufacturers toward plant level command dashboards. Logistics operators emphasize fleet and fulfillment visibility, Healthcare organizations prioritize capacity and clinical operations, and Government agencies increasingly monitor digital services and infrastructure. Vendors are responding with sector templates, industrial connectors, cloud partnerships, and configurable deployment models. Future competition will favor providers capable of translating sector specific telemetry into immediately actionable operating indicators.
North America accounted for the largest market share at 39% in 2025 however, Asia Pacific is expected to register the fastest growth, expanding at a CAGR of 15.2% between 2026 and 2033.
Cloud Scale Drives Unified Control Towers
North America represented about 39% of 2025 deployment, supported by dense cloud infrastructure, mature enterprise analytics spending, and extensive use of live operational intelligence across banking, retail, healthcare, logistics, and technology. US organizations increasingly consolidate fragmented monitoring interfaces into cloud based control towers connecting commercial and operational metrics. Canada adds demand through financial services, telecommunications, energy, and public sector digitalization. More than 5,000 US data centers provide substantial infrastructure for high frequency analytics workloads, while hyperscale operators continue adding AI optimized capacity. Enterprises are also connecting dashboards with data lakehouses and observability platforms, reducing dependence on separate departmental reporting stacks. Platform suppliers are expanding native connectors, governed metric layers, and consumption based deployment models to capture larger enterprise workloads while shortening integration cycles.
United States Market Outlook: The United States remains the principal deployment center because enterprises operate extensive SaaS, cloud, financial, healthcare, and digital commerce environments requiring continuous monitoring. US data center electricity consumption reached about 176 TWh in 2023, illustrating the scale of digital infrastructure requiring operational visibility. Providers benefit from concentrated hyperscaler ecosystems, enterprise software expertise, and advanced data engineering capabilities.
Sovereign Data Reshapes Analytics Architecture
Europe accounted for an estimated 27% share in 2025, with Germany, the United Kingdom, France, and the Netherlands concentrating enterprise analytics adoption. Deployment increasingly reflects regulatory architecture as organizations combine live operational visibility with stricter governance, lineage, residency, and access requirements. Around 45% of EU enterprises purchased cloud computing services in 2023, establishing a substantial foundation for hosted dashboard workloads. Manufacturing, energy, banking, transportation, and public services provide particularly valuable use cases because operational decisions depend on continuously changing data. European organizations are also modernizing analytics around interoperable data spaces and sovereign cloud environments rather than transferring every workload into unrestricted public infrastructure. Vendors are responding with regional hosting, granular permissions, auditable metric definitions, and hybrid deployment options, making governance capability an increasingly important procurement differentiator.
Germany Market Outlook: Germany offers strong demand through its industrial production base and approximately 3.1 million manufacturing employees in larger manufacturing enterprises. Factory digitization is connecting machine telemetry, production scheduling, energy consumption, and quality indicators with plant dashboards. Suppliers capable of integrating industrial protocols with enterprise analytics gain an advantage where legacy machinery and modern cloud systems must operate simultaneously.
Digital Scale Accelerates Live Analytics
Asia Pacific represented approximately 24% of the market in 2025, with China, India, Japan, Australia, Singapore, and South Korea generating diverse deployment requirements. China’s manufacturing and digital platform scale supports high volume operational monitoring, while India’s expanding digital infrastructure creates substantial demand across financial services, telecommunications, ecommerce, logistics, and IT services. Japan and South Korea emphasize manufacturing automation and connected infrastructure, whereas Singapore provides a concentrated environment for financial and logistics analytics. India had more than 950 million internet subscribers by 2024, creating a vast digital activity base requiring continuous service and transaction visibility. Providers are expanding local cloud regions, multilingual interfaces, mobile analytics, and industry specific integrations. Deployment increasingly favors architectures capable of handling high transaction volumes without sacrificing latency or localized data control.
India Market Outlook: India combines large digital transaction volumes with extensive technology services expertise and rapidly expanding data center capacity. UPI processed more than 18 billion transactions in a single month during 2025, creating operational monitoring requirements across banks, payment processors, merchants, and infrastructure providers. Domestic engineering talent also supports customized dashboard implementation and integration for complex enterprise environments.
Cloud Modernization Expands Operational Visibility
South America accounted for about 6% of 2025 deployment, with Brazil leading adoption through banking, digital commerce, telecommunications, logistics, energy, and industrial operations. Chile and Colombia provide additional demand from financial services, mining, retail, and digitally modernizing enterprises. Brazil’s instant payment infrastructure creates particularly intensive monitoring requirements because PIX routinely processes billions of transactions monthly, requiring payment participants to track availability, exceptions, fraud indicators, and service performance continuously. Regional cloud availability has improved as hyperscalers add infrastructure, allowing enterprises to reduce dependence on distant hosting locations. However, uneven connectivity outside major industrial centers and shortages of advanced data engineering skills complicate large scale implementation. Vendors are responding through managed analytics services, local cloud partnerships, preconfigured industry dashboards, and lower complexity integration tools.
Brazil Market Outlook: Brazil provides the region’s strongest analytics deployment base through more than 150 million PIX users, sophisticated banks, large retailers, telecommunications operators, and industrial enterprises. Live dashboards increasingly connect payment activity with service availability and customer operations. São Paulo’s dense cloud and data center ecosystem gives providers an infrastructure advantage for latency sensitive enterprise workloads.
Smart Infrastructure Expands Command Analytics
Middle East and Africa represented approximately 4% of the market in 2025, with the UAE, Saudi Arabia, South Africa, and selected African digital economies concentrating deployments. Gulf investment in smart cities, airports, utilities, financial services, logistics, and government digitization is creating control environments where dashboards aggregate live infrastructure and service indicators. Saudi Arabia’s Vision 2030 programs and the UAE’s digital government agenda are accelerating cloud and data platform modernization. Africa presents a more fragmented infrastructure profile, although telecommunications, mobile financial services, mining, and utilities provide practical monitoring applications. Cloud providers are adding regional infrastructure, improving workload localization and latency. Dashboard vendors are consequently prioritizing Arabic interfaces, managed deployments, mobile access, and integrations with smart infrastructure platforms rather than relying on standardized enterprise implementations.
United Arab Emirates Market Outlook: The UAE combines 99% internet penetration with concentrated banking, aviation, logistics, utilities, and government digital services, creating favorable conditions for live operational intelligence. Dubai and Abu Dhabi increasingly use integrated digital platforms for infrastructure and service management. Local cloud regions also allow enterprises to deploy latency sensitive analytics while maintaining stronger control over regulated data.
Microsoft, Salesforce, Google, Amazon Web Services, and Qlik compete across cloud analytics, embedded intelligence, and enterprise visualization, while Grafana targets observability driven operational dashboards. The top five suppliers hold an estimated 52% combined share, reflecting platform concentration. Competition centers on ecosystem integration, query speed, AI assistance, and deployment flexibility. Cloud native architectures can cut dashboard provisioning time by 30%, semantic layers reduce metric reconciliation effort by 25%, and embedded analytics can raise user engagement by 20%. Microsoft and Google integrate dashboards with data platforms; Salesforce pushes agentic analytics; AWS embeds generative BI; Qlik emphasizes governed hybrid access. Partnerships with consultancies and cloud ecosystems accelerate enterprise expansion. The market is shifting from visualization licenses toward AI enabled decision platforms and integrated actions. Entry barriers include trusted semantic models, connector breadth, compute scale, security certification, and installed enterprise ecosystems. Winning requires low latency analytics, governed AI, extensive interoperability, and measurable workflow automation.
Microsoft
Salesforce
Amazon Web Services
Qlik
Grafana Labs
SAP
Oracle
IBM
Domo
Sisense
ThoughtSpot
Zoho Corporation
Klipfolio
Current dashboard stacks combine streaming ingestion, analytics, semantic modeling, and event driven visualization. Live refresh engines update visuals only when new data arrives, reducing unnecessary query activity by 15% versus fixed interval polling. Adoption is expanding across cloud data platforms, where lakehouse architectures can eliminate 20% of duplicated transformation work. Enterprises gain faster operational visibility while platform teams simplify pipeline management.
Emerging technology centers on generative interfaces, AI assisted dashboard creation, and governed semantic layers. Natural language generation can cut dashboard development time by 40%, while automated anomaly detection reduces manual metric scanning by 25%. Compared with legacy drag and drop authoring, prompt driven generation can produce complete multi sheet dashboard structures in minutes rather than hours. Software vendors and data intensive enterprises benefit most because reusable semantic definitions improve development speed and metric consistency.
Between 2026 and 2028, digital twins, multimodal analytics, adaptive visualization, and action APIs will push dashboards beyond observation. Streaming platforms increasingly connect live metrics with automated workflows, while AI agents interpret exceptions and initiate approved responses. Organizations integrating these capabilities can reduce time to action by 30%. Vendors combining real time processing, governed semantics, embedded AI, and workflow execution will gain a durable competitive advantage.
August 2024 Grafana Labs completed a $270 million transaction and surpassed 5,000 paying customers, strengthening investment capacity for its operational dashboard and observability platform while expanding enterprise scale beyond its 2,000 paying customers recorded in 2022, globally today.
November 2024 Microsoft made Fabric Real Time Intelligence generally available, adding Real Time Hub plus four new source options including Service Bus and Kafka. The release unified streaming ingestion, analysis, visualization, and action inside one Fabric environment globally.
April 2025 Salesforce launched Tableau Next with agentic analytics as more than 75% of business leaders faced pressure to demonstrate data value. The platform embeds AI powered semantic intelligence into dashboards, applications, and enterprise analytical workflows worldwide today.
October 2025 Amazon launched Quick Suite with more than 50 built in connectors and access to over 1,000 applications through integrations. Propulse Lab reduced average customer service ticket handling time by 80%, demonstrating measurable enterprise automation impact globally.
The Real-time Dashboard Market report evaluates six dashboard types: Operational, Analytical, Strategic, Executive, Embedded, and Mobile Dashboards. Application coverage spans KPI Monitoring, Performance Tracking, Sales Analytics, Financial Monitoring, Operations Monitoring, Customer Analytics, and Risk Monitoring across eight defined end user industries. The assessment examines deployment patterns from centralized executive visualization to embedded and operational intelligence.
Regional analysis covers North America, Europe, Asia Pacific, South America, and Middle East and Africa, comparing cloud infrastructure, enterprise digitization, data governance, and analytics maturity. Technology coverage includes streaming ingestion, semantic modeling, live refresh, AI assisted visualization, digital twins, and workflow integration. The 2026 to 2033 framework supports platform investment, geographic expansion, integration planning, vendor positioning, and infrastructure decisions as enterprises shift dashboard architectures toward continuously updated, context aware operational intelligence.
| Report Attribute/Metric | Report Details |
|---|---|
Market Revenue in 2025 | USD 4733.4 Million |
Market Revenue in 2033 | USD 12318.69 Million |
CAGR (2026 - 2033) | 12.7% |
Base Year | 2025 |
Forecast Period | 2026 - 2033 |
Historic Period | 2021 - 2025 |
Segments Covered | By Type
By Application
By End-User
|
Key Report Deliverable | Revenue Forecast, Growth Trends, Market Dynamics, Segmental Overview, Regional and Country-wise Analysis, Competition Landscape |
Region Covered | North America, Europe, Asia-Pacific, South America, Middle East, Africa |
Key Players Analyzed | Microsoft, Salesforce, Google, Amazon Web Services, Qlik, Grafana Labs, SAP, Oracle, IBM, Domo, Sisense, ThoughtSpot, Zoho Corporation, Klipfolio |
Customization & Pricing | Available on Request (10% Customization is Free) |