
Reports
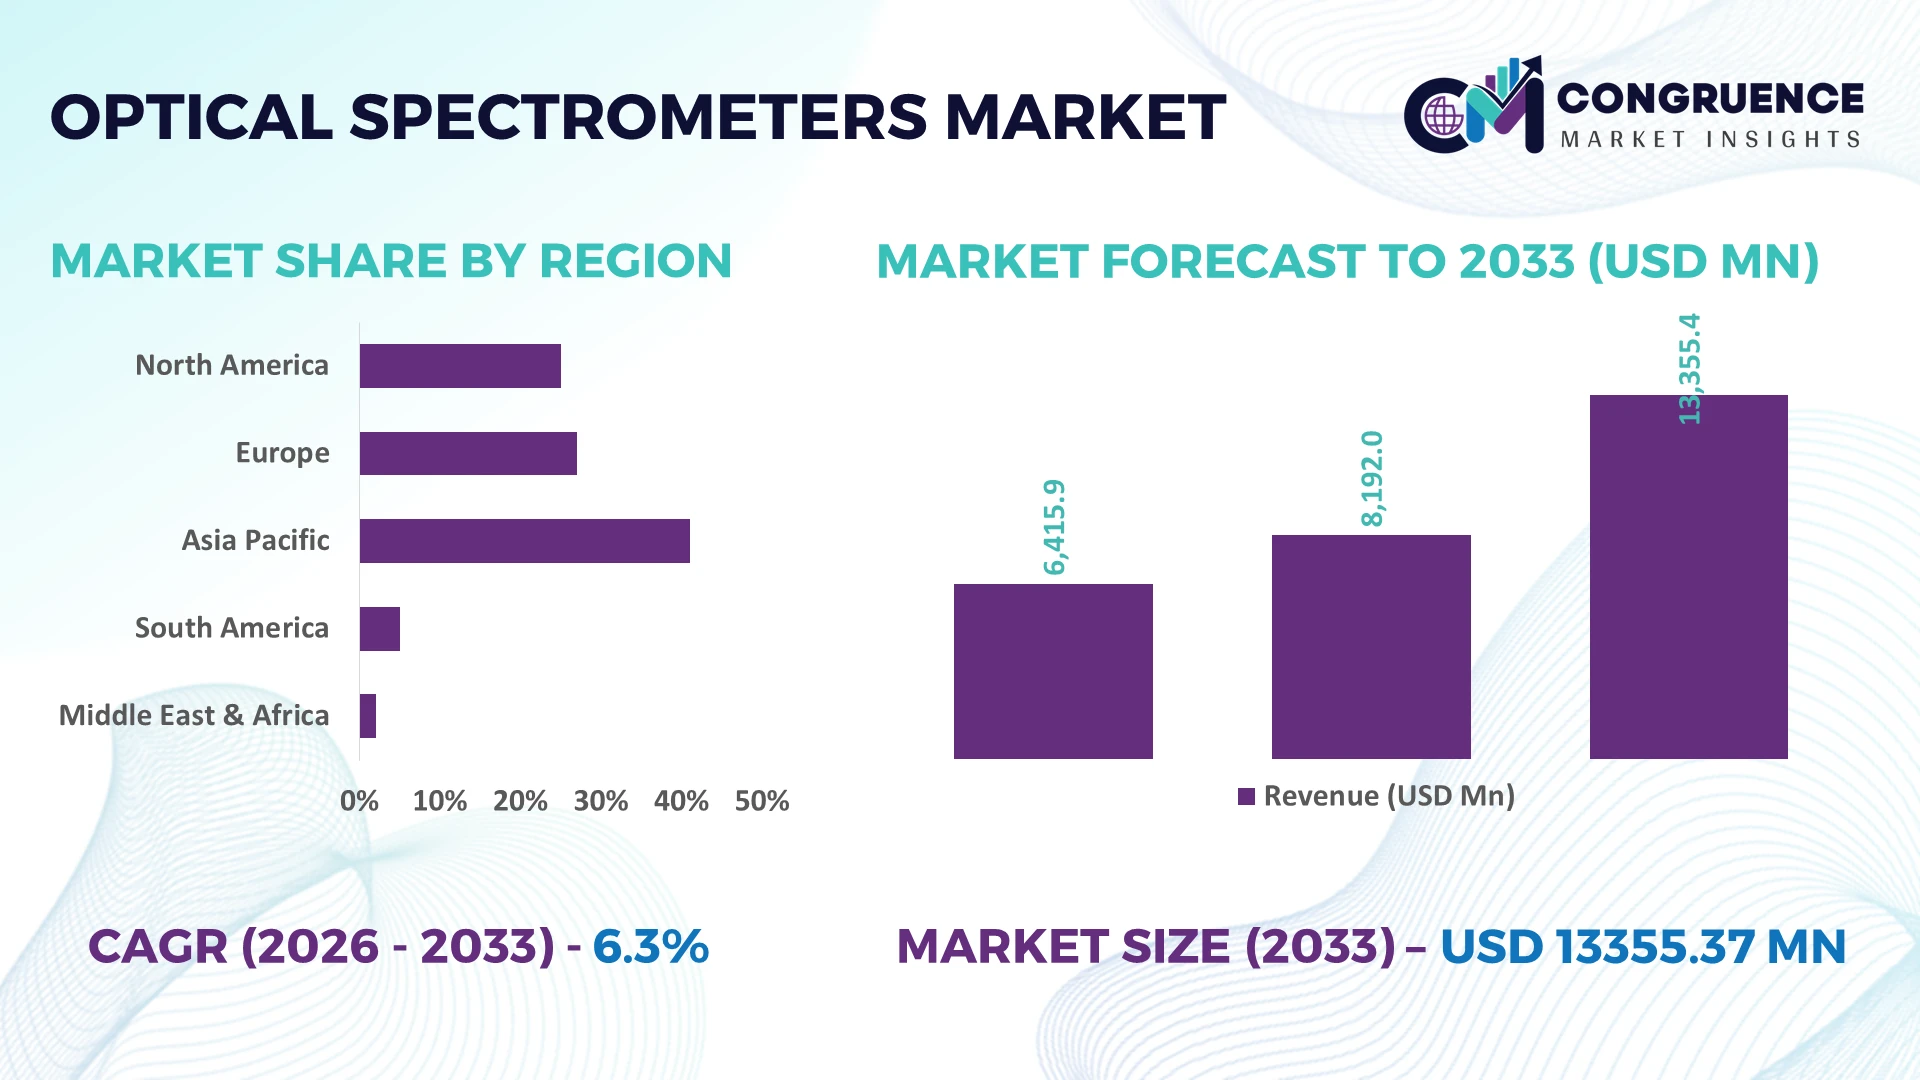
The Global Optical Spectrometers Market was valued at USD 8192 Million in 2025 and is anticipated to reach a value of USD 13355.37 Million by 2033 expanding at a CAGR of 6.3% between 2026 and 2033. Growth is driven by expanding semiconductor metrology, pharmaceutical quality control, advanced environmental monitoring, and precision manufacturing requiring faster, high-resolution optical analysis.
The United States leads the global optical spectrometers market with approximately 31% adoption across semiconductor fabrication, pharmaceutical research, and defense laboratories, supported by multi-billion-dollar manufacturing investments and advanced photonics infrastructure. China follows with nearly 24% share, accelerating deployment through electronics manufacturing and industrial automation, while export-control measures on advanced technologies continue reshaping procurement strategies and regional supply chains.
Market participants should prioritize localized manufacturing, high-performance analytical platforms, and resilient component sourcing to strengthen competitive positioning across high-value industrial and scientific applications.
Market Size & Growth: USD 8,192 million (2025) to USD 13,355.37 million (2033) at 6.3% CAGR, driven by advanced semiconductor inspection and laboratory automation.
Top Growth Drivers: Semiconductor testing (+18%), pharmaceutical analytical demand (+14%), environmental monitoring adoption (+12%) accelerate global expansion.
Short-Term Forecast: By 2028, automated optical analysis improves laboratory throughput by 22% while reducing testing turnaround time by 18%.
Emerging Technologies: AI-enabled spectral analysis, edge automation, and compact photonic components increase analytical accuracy by over 20%.
Regional Leaders: North America approaches USD 4.4 billion, Asia-Pacific USD 4.1 billion, Europe USD 2.8 billion, each expanding industrial digitalization and precision testing.
Consumer/End-User Trends: More than 58% of industrial laboratories prioritize portable, real-time optical spectroscopy platforms for faster decision-making.
Pilot/Case Example: A 2025 semiconductor inspection deployment improved defect detection by 27% through AI-assisted optical spectroscopy integration.
Competitive Landscape: Leading manufacturers collectively account for approximately 42% market share alongside Thermo Fisher Scientific, Agilent Technologies, HORIBA, Bruker, and Oxford Instruments.
Regulatory & ESG Impact: Environmental compliance programs increase emissions testing activity by 16%, strengthening demand for high-precision analytical instruments.
Investment & Funding: More than USD 1.5 billion supports photonics expansion, strategic partnerships, and regional manufacturing diversification amid supply-chain realignment.
Innovation & Future Outlook: Miniaturized spectroscopy, cloud-connected analytics, and hyperspectral integration accelerate next-generation industrial quality assurance and scientific research.
Optical spectrometers are experiencing stronger demand across semiconductor fabrication, life sciences, food safety, and environmental compliance as organizations require faster, non-destructive material characterization. AI-assisted spectral interpretation and compact photonic designs improve analytical productivity by nearly 20%, while regional manufacturing diversification and stricter quality-control requirements are reshaping procurement strategies, setting the foundation for the strategic market assessment that follows.
Optical spectrometers have become strategically important as manufacturers, research organizations, and regulated industries prioritize faster analytical workflows, traceable quality control, and digital laboratory modernization. Supply-chain restructuring for photonic components and detector technologies is encouraging greater localization, while stricter material verification and environmental compliance standards are increasing demand for high-precision spectral analysis. These shifts are strengthening competitive differentiation through instrument accuracy, software integration, and application-specific customization rather than hardware capability alone.
AI-assisted optical spectrometers reduce analytical processing time by nearly 30% compared with conventional standalone systems while improving repeatability by approximately 20% through automated spectral interpretation and calibration. The United States maintains leadership in advanced research deployment and semiconductor metrology, whereas China continues scaling industrial implementation through electronics manufacturing and domestic photonics capacity. Over the next two to three years, cloud-connected spectroscopy platforms are expected to exceed 45% adoption among newly installed enterprise laboratory systems, reflecting accelerated digital transformation.
A pharmaceutical manufacturer deploying automated inline optical spectrometers can reduce batch verification cycles by around 25%, improving production consistency while lowering manual intervention. Companies are expanding software ecosystems, investing in domestic manufacturing capabilities, and forming technology partnerships to strengthen resilience against component shortages. Organizations combining advanced analytics with localized supply networks will secure stronger competitive positioning, operational efficiency, and long-term market relevance.
Semiconductor fabrication, pharmaceutical manufacturing, and advanced materials research are increasing demand for high-resolution optical spectrometers capable of delivering rapid, traceable analysis. More than 60% of newly commissioned semiconductor quality laboratories now integrate automated spectroscopy platforms, while AI-enabled spectral processing improves inspection throughput by approximately 22% and reduces manual analytical effort by nearly 18%. Export-control policies affecting advanced manufacturing equipment are encouraging countries including the United States and Japan to strengthen domestic photonics capabilities. In response, leading manufacturers are expanding production capacity, investing in intelligent software platforms, and establishing collaborative partnerships with industrial automation providers. This transition positions spectroscopy as a core process-control technology rather than a standalone laboratory instrument.
High-performance detectors, diffraction gratings, and precision optical components remain concentrated within limited manufacturing ecosystems, creating supply dependency and procurement complexity. Lead times for specialized photonic components have remained approximately 20% above pre-disruption levels, while advanced detector costs fluctuate by nearly 15% because of material availability. Many industrial facilities also face interoperability limitations when integrating modern spectroscopy platforms with legacy laboratory information systems. These factors increase deployment costs and delay production schedules, particularly for small and mid-sized manufacturers. Companies are mitigating operational risks through supplier diversification, localized component sourcing, long-term procurement agreements, and modular system architectures that simplify integration without sacrificing analytical performance.
The strongest emerging opportunity lies in embedding optical spectrometers directly into automated production environments for continuous quality verification. AI-driven spectral analytics can reduce inspection time by approximately 25% while improving process consistency by nearly 20%. Japan and South Korea are accelerating smart manufacturing initiatives that encourage wider deployment of inline analytical instrumentation across electronics and advanced materials production. Manufacturers are increasing R&D investment in compact photonic designs, cloud-based analytics, and digital twin integration to create scalable industrial ecosystems. A less obvious advantage is predictive maintenance, where continuous spectral monitoring minimizes unexpected equipment downtime and improves utilization across high-value manufacturing assets.
Expanding optical spectrometer deployment across complex industrial operations requires specialized expertise in calibration, data interpretation, and enterprise software integration. Approximately 35% of industrial users report shortages of spectroscopy specialists, while integration projects can extend implementation timelines by nearly 20% when connecting multiple analytical platforms. Increasing cybersecurity requirements for cloud-connected laboratory systems also add operational complexity as digital infrastructure expands. Germany and the United States are investing in workforce development and secure industrial data architectures to support advanced analytical operations. Companies must strengthen technical training, standardized software interfaces, and secure digital infrastructure through targeted partnerships and engineering investment to achieve consistent, scalable deployment across global operations.
AI-Driven Spectral Intelligence AI-enabled spectral interpretation is reducing analytical processing time by nearly 30% while improving identification accuracy by around 20%. Pharmaceutical and semiconductor facilities in the United States are embedding machine-learning algorithms into laboratory workflows to offset skilled labor shortages. Instrument suppliers are expanding software capabilities, cloud connectivity, and analytics partnerships, enabling faster decision-making and standardized quality control across distributed testing environments.
Compact Portable Instrument Expansion Portable optical spectrometers now account for approximately 35% of newly deployed field-analysis systems, with inspection productivity improving by nearly 25% compared with conventional laboratory-only workflows. Environmental monitoring requirements and industrial maintenance programs are accelerating deployment across Japan and Germany. Manufacturers are redesigning instruments with lightweight optics, longer battery life, and ruggedized architectures to support real-time analysis in demanding operating conditions.
Localized Photonics Manufacturing Networks Supply-chain diversification is reshaping procurement strategies as companies reduce dependence on concentrated optical component suppliers. Nearly 40% of major manufacturers have expanded regional sourcing or localized assembly since 2025, shortening procurement cycles by about 15%. Enterprises are strengthening strategic partnerships with detector and optics suppliers while investing in modular product platforms that simplify manufacturing flexibility and improve operational resilience.
Integrated Process Monitoring Adoption Continuous inline spectroscopy is becoming standard across advanced manufacturing, reducing production deviations by approximately 18% and improving inspection throughput by nearly 22%. Electronics manufacturers in South Korea increasingly integrate spectrometers directly into automated production lines as digital factory initiatives expand. Equipment providers are responding through automation-focused product portfolios, industrial software integration, and collaborative development with process-control specialists to strengthen operational performance.
UV-Visible Spectrometers remain the dominant product category because they combine analytical versatility, lower operating costs, and broad deployment across pharmaceuticals, education, environmental testing, and industrial laboratories. Approximately 46% of installed laboratory spectroscopy platforms rely on UV-Visible technology due to standardized workflows and straightforward integration with automated laboratory systems. Infrared Spectrometers maintain strong demand in chemical characterization and polymer analysis, while Atomic Spectrometers remain indispensable for trace elemental testing in regulated industries. Manufacturers continue improving software interoperability and detector sensitivity to strengthen customer retention and expand application coverage.
Raman Spectrometers represent the fastest-growing type as non-destructive material identification becomes increasingly valuable in semiconductor manufacturing, life sciences, and forensic analysis. AI-assisted Raman interpretation improves analytical efficiency by nearly 20%, encouraging wider industrial adoption. Fluorescence Spectrometers continue gaining importance in biological research and pharmaceutical development through enhanced sensitivity. Companies are prioritizing compact instrument development, application-specific software, and collaborative research partnerships, reflecting a strategic investment shift toward intelligent spectroscopy platforms capable of supporting advanced industrial workflows.
Material Analysis represents the leading application because manufacturing, electronics, mining, and advanced materials industries require rapid composition verification and process consistency. Nearly 42% of industrial spectroscopy deployments support material characterization, where automated optical analysis reduces inspection time by approximately 22%. Chemical Analysis remains essential for production control and research laboratories, while Food Testing continues expanding through stricter product authenticity and contamination verification requirements. Vendors are strengthening automation capabilities and integrated laboratory software to improve analytical throughput and reduce manual intervention.
Environmental Testing is emerging as the fastest-growing application as governments and industrial operators expand emissions monitoring, water quality assessment, and pollution surveillance. Deployment activity has increased by nearly 18% across public and industrial testing laboratories. Pharmaceutical Testing also continues accelerating through higher validation standards and digital laboratory modernization. Companies are expanding application-specific instrument portfolios and strengthening service partnerships to capture demand from highly regulated analytical environments where operational reliability is becoming increasingly critical.
Pharmaceutical Companies remain the largest end-user group because drug development, formulation validation, and manufacturing quality assurance require continuous high-precision spectroscopy. Approximately 38% of enterprise optical spectrometer installations support pharmaceutical operations, where automated analytical workflows improve laboratory productivity by nearly 24%. Research Laboratories continue representing a stable demand base through scientific innovation and academic collaboration, while the Chemical Industry relies on spectroscopy for process optimization and product consistency. Suppliers increasingly deliver customized software, validation services, and compliance-focused instrument packages.
Environmental Agencies represent the fastest-growing end-user segment as regulatory monitoring programs and environmental compliance requirements expand. Instrument deployment across environmental laboratories has increased by approximately 17%, supported by greater investment in real-time monitoring infrastructure. Food & Beverage companies are also strengthening adoption to improve quality assurance and authenticity testing. Manufacturers are responding through application-focused product configurations, long-term service agreements, flexible pricing strategies, and collaborative ecosystem development, enabling stronger competitive positioning across diverse analytical environments.
North America accounted for the largest market share at 36.4% in 2025 however, Asia-Pacific is expected to register the fastest growth, expanding at a 7.4% CAGR between 2026 and 2033.

Advanced Manufacturing and Laboratory Digitalization Drive Market Leadership
North America maintains the largest share of the Optical Spectrometers Market through its concentration of semiconductor manufacturing, pharmaceutical production, national research laboratories, and advanced analytical infrastructure. More than 40% of high-end spectroscopy deployments are integrated with automated laboratory information systems, supporting faster analytical workflows and regulatory compliance. Continued investment in semiconductor fabrication and life sciences strengthens demand for precision optical measurement platforms. Companies are expanding software-enabled spectroscopy solutions, strengthening domestic production capabilities, and forming automation partnerships to improve workflow efficiency while reducing instrument downtime across industrial and research environments.
United States Market Outlook: The United States remains the regional technology leader through its extensive semiconductor ecosystem, pharmaceutical manufacturing base, and photonics innovation network. Advanced manufacturing facilities increasingly deploy AI-assisted spectroscopy for inline quality verification, with automated analytical platforms improving inspection productivity by nearly 25%. Federal investment in semiconductor capacity and laboratory modernization continues encouraging domestic instrument manufacturing, while collaboration between research institutions and industrial enterprises accelerates commercialization of next-generation optical spectroscopy technologies.
Industrial Sustainability and Precision Manufacturing Accelerate Adoption
Europe represents a mature analytical instrumentation market supported by pharmaceutical production, advanced chemical manufacturing, environmental monitoring, and scientific research infrastructure. Approximately 29% of industrial laboratories have upgraded spectroscopy platforms during recent modernization programs, improving analytical efficiency and digital integration. Sustainability regulations and stricter product quality standards continue driving investment in high-precision laboratory instrumentation. Manufacturers are strengthening regional engineering capabilities, expanding calibration services, and integrating intelligent software to improve compliance, operational consistency, and long-term laboratory productivity.
Germany Market Outlook: Germany leads the European market through its advanced industrial manufacturing, precision engineering expertise, and strong analytical instrumentation ecosystem. Automotive, specialty chemicals, and industrial automation sectors increasingly utilize optical spectrometers for material verification and production quality assurance. More than 30% of newly commissioned industrial analytical systems incorporate advanced digital connectivity, while manufacturers continue investing in photonics research, industrial automation partnerships, and intelligent laboratory solutions supporting highly standardized manufacturing environments.
Manufacturing Expansion and Photonics Capacity Fuel Deployment
Asia-Pacific is emerging as the fastest-expanding regional market due to rapid electronics manufacturing, semiconductor investment, pharmaceutical production, and industrial automation. Nearly 45% of newly established electronics manufacturing facilities integrate advanced optical inspection technologies during production line development. Governments continue supporting domestic photonics manufacturing and laboratory infrastructure modernization to reduce technology dependence. Instrument manufacturers are expanding regional production facilities, strengthening local supply chains, and introducing cost-optimized product portfolios designed for high-volume industrial deployment and quality assurance.
China Market Outlook: China dominates regional deployment through its extensive electronics manufacturing base, expanding semiconductor industry, and growing analytical testing infrastructure. Industrial facilities increasingly implement inline optical spectroscopy to improve process consistency and reduce production defects by approximately 20%. Domestic manufacturers continue expanding photonics production capacity while strengthening collaboration with automation providers, enabling broader adoption of advanced spectroscopy across pharmaceuticals, environmental monitoring, advanced materials, and precision manufacturing sectors.
Industrial Quality Programs Support Market Expansion
South America is experiencing steady market development through mining, food processing, agriculture, environmental monitoring, and pharmaceutical quality assurance activities. Approximately 18% of new laboratory modernization projects now include upgraded optical spectroscopy platforms for faster analytical testing. Infrastructure limitations and import dependency remain operational constraints, yet industrial digitization initiatives continue supporting broader deployment. Companies are expanding regional service capabilities, establishing distributor partnerships, and improving technical support networks to enhance instrument utilization and reduce maintenance delays across industrial customers.
Brazil Market Outlook: Brazil represents the largest national market because of its diversified industrial economy, agricultural exports, mining operations, and expanding pharmaceutical manufacturing sector. Food quality laboratories and mining companies increasingly deploy optical spectrometers for contamination analysis and material characterization, with automated analytical workflows improving laboratory productivity by nearly 18%. Investment in industrial modernization and scientific research infrastructure continues strengthening long-term demand for advanced analytical instrumentation across multiple sectors.
Infrastructure Modernization Strengthens Analytical Capabilities
The Middle East & Africa market is expanding through industrial diversification, environmental monitoring, petrochemical investment, and laboratory modernization initiatives. Approximately 22% of newly upgraded industrial laboratories now include advanced spectroscopy platforms supporting higher analytical precision and regulatory compliance. National infrastructure programs are strengthening scientific research capabilities while increasing investment in digital laboratory technologies. Equipment suppliers are expanding regional partnerships, technical service centers, and localized training programs to improve deployment efficiency and operational reliability across emerging analytical markets.
Saudi Arabia Market Outlook: Saudi Arabia leads regional demand through large-scale petrochemical production, industrial diversification initiatives, and expanding research infrastructure. Energy, environmental monitoring, and chemical processing facilities increasingly utilize advanced optical spectrometers for process optimization and emissions analysis, with automated systems reducing laboratory processing time by approximately 20%. Continued investment in industrial technology, research institutions, and advanced manufacturing capabilities supports broader deployment of precision analytical instrumentation across strategic industrial sectors.
The Optical Spectrometers Market is led by Thermo Fisher Scientific, Agilent Technologies, HORIBA, Bruker Corporation, and Oxford Instruments, competing against specialized spectroscopy innovators and cost-focused regional manufacturers, particularly across China and Japan. The top five companies collectively control approximately 44% of global market activity, while regional suppliers compete aggressively in price-sensitive industrial and academic segments. Competition centers on analytical accuracy, software intelligence, customization, and delivery speed rather than pricing alone. AI-enabled spectral analysis improves laboratory productivity by nearly 25%, while modular instrument architectures reduce deployment time by approximately 18%, creating measurable operational advantages. Leading manufacturers strengthen positions through localized production, strategic research partnerships, cloud-enabled software platforms, and application-focused product development. Regional competitors expand through competitive pricing and faster customer support, challenging premium suppliers in routine laboratory applications. Increasing integration of spectroscopy with industrial automation is accelerating technology-led differentiation, while precision optics expertise and software ecosystems remain significant entry barriers. Winning requires superior analytical performance, resilient component sourcing, rapid application development, and strong customer integration capabilities.
Thermo Fisher Scientific
Agilent Technologies
HORIBA Ltd.
Bruker Corporation
Oxford Instruments plc
Shimadzu Corporation
PerkinElmer
Hitachi High-Tech Corporation
JASCO Corporation
ABB
Ocean Insight
Avantes
StellarNet Inc.
B&W Tek
Advanced optical spectrometers are increasingly integrating AI-assisted spectral interpretation, cloud-connected laboratory platforms, and automated calibration systems to improve analytical speed and consistency. More than 48% of newly deployed enterprise laboratory instruments now incorporate intelligent software capabilities, while automated calibration reduces operator intervention by approximately 22%. Compared with conventional standalone instruments, AI-enabled systems improve spectral identification accuracy by nearly 20% and shorten analytical processing time by around 30%, allowing laboratories to increase throughput without proportional workforce expansion.
Emerging technologies include compact photonic components, hyperspectral imaging integration, edge computing, and miniaturized optical sensors designed for continuous industrial monitoring. Inline spectroscopy deployment has increased by approximately 26% across semiconductor and pharmaceutical production environments, enabling real-time process control and faster quality verification. Global technology leaders benefit most from these advances because integrated hardware, software, and analytics ecosystems create stronger customer retention and higher operational efficiency than hardware-only product strategies.
Between 2026 and 2028, digital spectroscopy platforms will increasingly integrate predictive analytics, digital twins, and industrial automation networks to support autonomous quality management. Adoption of cloud-based spectroscopy workflows is expected to exceed 55% among newly modernized analytical laboratories, reducing reporting cycles by nearly 18%. Companies investing early in intelligent analytics, cybersecurity, and interoperable software architectures will secure stronger competitive differentiation, faster product validation, and more resilient industrial operations.
June 2025 Thermo Fisher Scientific launched the Orbitrap Astral Zoom mass spectrometer featuring 35% faster scan speeds, 40% higher throughput, and 50% greater multiplexing capability, strengthening high-performance analytical workflows for biopharmaceutical and proteomics research.
February 2025 Shimadzu Corporation introduced the ALTRACE Energy Dispersive X-Ray Fluorescence Spectrometer with industry-leading measurement sensitivity, enabling higher analytical accuracy for food and environmental testing while improving operational efficiency in regulated laboratory applications. Source: (Shimadzu Corporation)
January 2026 HORIBA introduced the PoliSpectra® 27 compact industrial spectrometer platform optimized for high-volume manufacturing, delivering a lightweight architecture that supports scalable deployment across automated production environments and strengthens inline quality-control capabilities. Source: (Horiba)
June 2026 Industry analysis highlighted accelerated commercialization of AI-enabled infrared and near-infrared spectroscopy, with miniaturized platforms expanding field deployment and improving analytical speed across environmental and industrial applications, reinforcing digital laboratory transformation. Source: (Spectroscopy Online)
The report delivers comprehensive analysis across UV-Visible Spectrometers, Infrared Spectrometers, Raman Spectrometers, Fluorescence Spectrometers, and Atomic Spectrometers while evaluating Material Analysis, Pharmaceutical Testing, Environmental Testing, Food Testing, and Chemical Analysis. It further assesses demand across pharmaceutical companies, research laboratories, food and beverage enterprises, chemical manufacturers, and environmental agencies, covering more than 30 strategic country markets with detailed regional comparisons and deployment trends.
The study examines technology adoption, AI-enabled spectroscopy, laboratory automation, miniaturized photonics, and inline industrial analytics while tracking competitive positioning, product innovation, and manufacturing expansion. It evaluates deployment patterns, enterprise purchasing priorities, application-specific growth, and evolving investment strategies between 2026 and 2033. The report supports expansion planning, portfolio optimization, competitive benchmarking, partnership evaluation, and long-term business decision-making through actionable operational, technological, and regional market intelligence.
| Report Attribute/Metric | Report Details |
|---|---|
Market Revenue in 2025 | USD 8192 Million |
Market Revenue in 2033 | USD 13355.37 Million |
CAGR (2026 - 2033) | 6.3% |
Base Year | 2025 |
Forecast Period | 2026 - 2033 |
Historic Period | 2021 - 2025 |
Segments Covered | By Type
By Application
By End-User
|
Key Report Deliverable | Revenue Forecast, Growth Trends, Market Dynamics, Segmental Overview, Regional and Country-wise Analysis, Competition Landscape |
Region Covered | North America, Europe, Asia-Pacific, South America, Middle East, Africa |
Key Players Analyzed | Thermo Fisher Scientific, Agilent Technologies, HORIBA Ltd., Bruker Corporation, Oxford Instruments plc, Shimadzu Corporation, PerkinElmer, Hitachi High-Tech Corporation, JASCO Corporation, ABB, Ocean Insight, Avantes, StellarNet Inc., B&W Tek |
Customization & Pricing | Available on Request (10% Customization is Free) |