
Reports
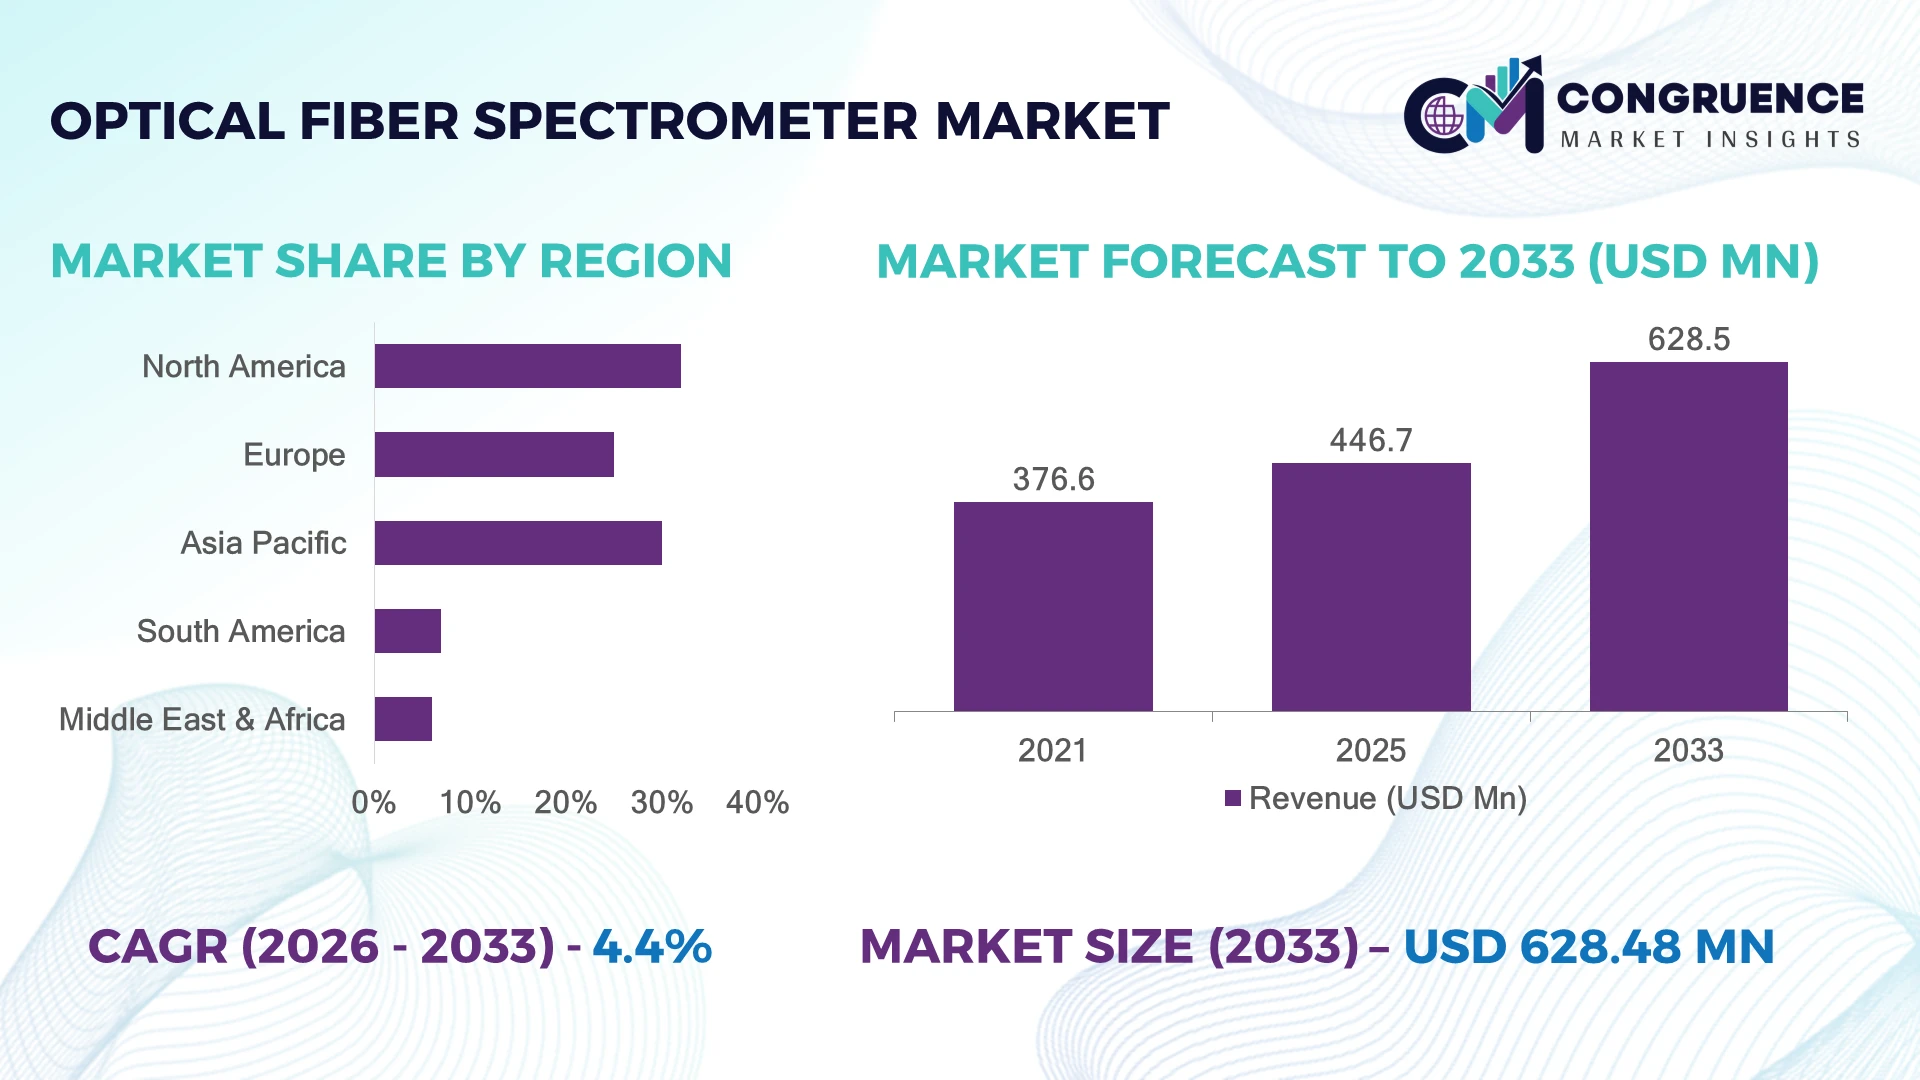
The Global Optical Fiber Spectrometer Market was valued at USD 446.7 Million in 2025 and is anticipated to reach a value of USD 628.5 Million by 2033 expanding at a CAGR of 4.36% between 2026 and 2033. Growth is driven by rising adoption of compact high-resolution spectroscopy systems in semiconductor inspection, pharmaceutical quality control, environmental monitoring, and advanced manufacturing.
The United States remains a leading market, accounting for nearly 32% adoption share, supported by investments in photonics research, semiconductor fabs, and aerospace testing. China follows with around 25% share, driven by domestic optical manufacturing expansion and industrial automation programs. Japan’s precision instrumentation sector maintains strong adoption, with over 40% of advanced laboratories integrating fiber-based spectroscopy tools.
Strategic focus on regional supply chains and high-accuracy measurement capabilities will define competitive advantage.
Market Size & Growth: USD 446.7 Million in 2025 to USD 628.5 Million by 2033, with 4.36% CAGR, driven by semiconductor inspection and precision optical measurement upgrades.
Top Growth Drivers: Semiconductor applications 38%, pharmaceutical analysis 27%, environmental monitoring 21% are the leading demand contributors.
Short-Term Forecast: By 2028, automated spectrometer integration reduces calibration time by 30% and improves laboratory throughput by 25%.
Emerging Technologies: AI-assisted spectral analysis, miniaturized sensors, and cloud-connected spectroscopy platforms are reshaping advanced optical systems.
Regional Leaders: North America reaches USD 210 Million with photonics expansion; Asia Pacific reaches USD 250 Million with manufacturing adoption; Europe reaches USD 120 Million with industrial automation growth.
Consumer/End-User Trends: More than 55% of new laboratory installations prioritize compact fiber-coupled spectrometers for flexible testing workflows.
Pilot/Case Example: 2024 semiconductor testing projects using automated spectroscopy achieved nearly 20% faster defect detection cycles.
Competitive Landscape: Leading suppliers include Ocean Insight, Hamamatsu Photonics, Horiba, Thorlabs, and Avantes, with top players collectively holding around 45% market influence.
Regulatory & ESG Impact: Advanced monitoring systems support environmental compliance programs, improving measurement accuracy by over 30% in industrial applications.
Investment & Funding: More than USD 1.2 Billion is being directed into photonics, semiconductor, and optical technology partnerships globally.
Innovation & Future Outlook: Next-generation spectrometers focus on AI interpretation, portable designs, and integrated sensing networks for industrial transformation.
Optical Fiber Spectrometer solutions are gaining importance across scientific research, healthcare diagnostics, and industrial inspection due to improvements in spectral accuracy, portability, and real-time analysis. Recent innovations include AI-enabled interpretation, ultra-compact optical modules, and enhanced detector sensitivity. Around 35% of new spectroscopy deployments emphasize automated data processing. Global supply-chain diversification and stricter measurement standards are accelerating adoption across advanced manufacturing ecosystems.
The Optical Fiber Spectrometer Market is becoming strategically important as industries require faster, more accurate, and portable analysis systems for quality control, research, and automated production environments. Semiconductor localization initiatives, laboratory modernization, and stricter industrial monitoring requirements are accelerating investments in advanced spectroscopy infrastructure.
Modern fiber-based spectrometers deliver higher flexibility and faster measurements compared with traditional benchtop systems, reducing setup requirements by nearly 40% while enabling remote sensing capabilities. North America leads in research-driven adoption, while Asia Pacific demonstrates stronger manufacturing deployment due to semiconductor expansion and electronics production growth. Europe continues advancing precision measurement applications through industrial automation and sustainability-focused monitoring programs.
Companies are increasingly forming technology partnerships to improve detector performance, miniaturize devices, and expand application coverage. Pharmaceutical manufacturers are deploying fiber spectrometers for rapid material verification, while semiconductor producers integrate them into inspection workflows to improve process consistency. Over the next 2–3 years, adoption of automated spectroscopy platforms is expected to rise as industries prioritize operational efficiency, digital integration, and reliable real-time analytics. Competitive positioning will depend on innovation speed, regional manufacturing strength, and the ability to deliver scalable optical measurement solutions.
Growing demand for high-accuracy optical analysis in semiconductor, pharmaceutical, and advanced manufacturing applications is accelerating fiber spectrometer adoption. Semiconductor fabs in South Korea and Taiwan are increasing optical inspection investments, with automated measurement systems improving process monitoring efficiency by 25–35%. Pharmaceutical laboratories are shifting toward real-time spectral verification, with over 40% of new analytical workflows incorporating compact spectroscopy tools. Companies are responding through detector innovation, strategic partnerships, and localized production to reduce dependency on imported optical components. The key strategic shift is the integration of fiber spectrometers into automated quality-control platforms, enabling faster decisions and reducing production variability.
High-performance optical detectors, precision gratings, and specialized fiber components create supply-chain pressure for spectrometer manufacturers. Imported photonic components account for nearly 50% of critical inputs in several manufacturing ecosystems, increasing exposure to logistics disruptions and pricing fluctuations. Smaller enterprises face deployment barriers as system customization costs can increase installation expenses by 20–30%. China, Japan, and European manufacturers are addressing these limitations through supplier diversification, domestic component development, and long-term procurement agreements. The major operational challenge remains balancing advanced performance requirements with scalable manufacturing economics, particularly for applications requiring customized spectral ranges and high-resolution outputs.
Emerging opportunities are developing through AI-driven spectral interpretation, miniaturized optical sensors, and portable spectrometer platforms. AI-assisted analysis can reduce manual data interpretation workloads by approximately 40%, improving productivity in laboratories and industrial inspection environments. India and Southeast Asian manufacturing hubs are expanding adoption of compact measurement solutions as electronics and pharmaceutical production capacities increase. Companies are investing in software integration, cloud-based analytics, and collaborative R&D programs to create intelligent spectroscopy ecosystems. A key opportunity lies in combining fiber spectrometers with edge computing platforms, enabling real-time process adjustments and opening demand from decentralized testing environments beyond traditional laboratories.
The market faces execution challenges related to complex system integration, cybersecurity requirements, and limited availability of specialized photonics expertise. Around 30% of industrial users report difficulties integrating advanced optical instruments with existing automation infrastructure, creating deployment delays. The growing use of connected spectroscopy platforms also increases data security requirements for industrial environments. Germany, the United States, and Japan are addressing workforce shortages through photonics training programs and industry-academia partnerships. Companies must improve interoperability standards, strengthen software capabilities, and expand technical support networks to ensure consistent deployment. Long-term competitiveness will depend on creating scalable solutions that combine optical accuracy with digital manufacturing requirements.
AI Spectral Analytics Adoption AI-enabled spectral processing is reshaping optical fiber spectrometer workflows, with automated interpretation reducing manual analysis requirements by nearly 40% and improving laboratory throughput by 25%. Pharmaceutical and semiconductor companies are integrating machine-learning algorithms for faster anomaly detection and predictive quality control. The shift is accelerating as enterprises prioritize real-time decision systems, with manufacturers expanding software partnerships and embedding intelligent analytics into next-generation spectrometer platforms.
Miniaturized Device Deployment Compact and portable fiber spectrometers are gaining traction as industrial users demand flexible measurement solutions outside traditional laboratories. More than 35% of new spectroscopy installations emphasize smaller form factors, while portable systems reduce testing setup time by approximately 30%. Companies are responding through modular product designs, improved detector packaging, and expanded applications in field inspection, environmental monitoring, and decentralized testing environments.
Automation-Driven Quality Control Industrial automation is transforming spectroscopy deployment, particularly in semiconductor and electronics manufacturing hubs. Automated optical measurement systems improve inspection consistency by 20–30% and reduce operator intervention across production lines. Supply-chain restructuring and skilled labor shortages are pushing manufacturers in countries such as Japan and South Korea to integrate fiber spectrometers into automated inspection ecosystems, creating demand for connected and scalable solutions.
Advanced Photonics Integration Integration of advanced photonics components is improving spectrometer sensitivity, speed, and application flexibility. New optical modules achieve approximately 15–25% performance improvements through enhanced detectors and precision components. Companies are increasing investments in photonics partnerships and localized manufacturing strategies as global supply-chain risks encourage alternative sourcing models. A non-obvious shift is the growing use of fiber spectrometers in compact industrial systems rather than only research environments.
Fiber Optic Spectrometers are primarily segmented into Portable Spectrometers, Benchtop Spectrometers, and Miniature Spectrometers. Benchtop spectrometers represent the leading type due to their superior resolution, broader wavelength coverage, and extensive use in research laboratories, semiconductor testing, and industrial quality-control environments. These systems account for nearly 45% of professional spectroscopy installations, supported by demand for precise analytical measurements and advanced calibration capabilities. Companies continue enhancing benchtop platforms through improved detectors, automation features, and software integration. Miniature spectrometers are emerging as the fastest-growing type as industries prioritize compact, flexible, and field-deployable solutions. Adoption is increasing in environmental monitoring, medical diagnostics, and portable inspection applications, with miniature systems representing over 30% of new device development projects. Portable spectrometers maintain strong relevance in remote testing and industrial maintenance, while companies are investing in lightweight designs and wireless connectivity to expand application coverage.
Optical Fiber Spectrometers are widely used across Semiconductor & Electronics Testing, Pharmaceutical & Biotechnology Analysis, Environmental Monitoring, Research & Development, and Industrial Quality Control applications. Semiconductor and electronics testing remains the leading application segment, supported by increasing requirements for defect detection, material characterization, and process optimization. This segment contributes nearly 35% of overall application demand as manufacturers in Taiwan, South Korea, and the United States expand advanced fabrication capabilities. Environmental monitoring and pharmaceutical analysis are among the fastest-growing applications due to stricter compliance requirements and increased adoption of real-time analytical systems. Pharmaceutical companies are integrating spectroscopy into quality verification workflows, while environmental agencies are deploying compact systems for field measurements. More than 40% of new industrial spectroscopy deployments emphasize automation and real-time data collection. Companies are responding through application-specific solutions, software integration, and partnerships with industrial automation providers.
The Optical Fiber Spectrometer Market serves Semiconductor Manufacturers, Pharmaceutical Companies, Research Institutions, Environmental Agencies, and Industrial Manufacturers. Semiconductor manufacturers represent the dominant end-user group due to intensive requirements for optical inspection, wafer analysis, and process monitoring. This segment accounts for approximately 38% of demand, driven by semiconductor expansion initiatives in countries including the United States, Japan, South Korea, and Taiwan. Companies are increasing investments in integrated spectroscopy solutions to improve manufacturing precision and reduce production losses. Research institutions and pharmaceutical companies represent the fastest-growing end-user groups as laboratories adopt compact and automated spectroscopy platforms. Research organizations are moving toward flexible optical systems for material science and photonics studies, while pharmaceutical firms are expanding usage for formulation testing and quality control. Nearly 35% of new laboratory instrument purchases emphasize automation, connectivity, and improved analytical speed. Manufacturers are targeting these segments through customized solutions, academic partnerships, and software-enabled platforms.
North America accounted for the largest market share at 32% in 2025 however, Asia-Pacific is expected to register the fastest growth, expanding at a CAGR of 5.1% between 2026 and 2033.

North America holds a leading position in the Optical Fiber Spectrometer Market due to strong demand from semiconductor manufacturing, aerospace testing, pharmaceutical research, and defense applications. The region contributes nearly 32% of global adoption, supported by advanced R&D infrastructure and high investments in precision measurement technologies. The United States accounts for the majority of regional deployments, with semiconductor and photonics companies integrating fiber spectrometers into automated inspection workflows. More than 45% of industrial users in advanced manufacturing prioritize real-time optical analysis for quality improvement. Companies are expanding through partnerships with research institutions and investing in AI-enabled spectroscopy platforms to improve measurement speed and operational efficiency.
United States Market Outlook: The United States remains the primary contributor due to its semiconductor expansion, aerospace innovation, and strong photonics ecosystem. Over 30 semiconductor fabrication projects announced in recent years are increasing demand for advanced inspection technologies. Enterprises are adopting compact and automated spectrometer systems to support domestic manufacturing initiatives and reduce dependency on external testing capabilities.
Europe maintains a strong market position through advanced industrial automation, scientific research capabilities, and strict quality-control requirements across manufacturing sectors. The region represents approximately 25% of global adoption, supported by Germany, the United Kingdom, and France. Increasing emphasis on industrial sustainability monitoring and precision manufacturing is encouraging the integration of optical spectroscopy systems. Germany’s automotive and engineering sectors are major deployment centers, with more than 35% of industrial laboratories prioritizing automated analytical instruments. Companies are focusing on localized production, strategic collaborations, and enhanced software capabilities to meet evolving measurement requirements and improve operational reliability.
Germany Market Outlook: Germany leads European adoption through its advanced manufacturing base, automotive innovation, and industrial automation ecosystem. More than 40% of major manufacturing facilities use advanced sensing technologies for process optimization. German companies are investing in precision optical systems to strengthen smart factory initiatives and maintain leadership in high-value engineering applications.
Asia-Pacific represents the fastest-expanding market for Optical Fiber Spectrometers, driven by semiconductor production, electronics manufacturing, and industrial automation growth. The region contributes around 30% of global demand and benefits from large-scale manufacturing ecosystems in China, Japan, South Korea, and Taiwan. Semiconductor fabrication investments and electronics supply-chain expansion are increasing the need for high-precision optical inspection. China and South Korea together account for a significant share of regional deployments, with more than 50% of new industrial spectroscopy installations linked to electronics and semiconductor applications. Companies are expanding production capacity, forming technology partnerships, and developing compact spectrometer solutions for large-scale industrial use.
China Market Outlook: China is a major growth center due to its electronics manufacturing capacity and domestic photonics development programs. The country supports over 30% of Asia-Pacific semiconductor production capacity, creating strong demand for optical measurement systems. Manufacturers are increasing investments in localized components and automated testing solutions to strengthen supply-chain resilience.
South America is developing as an emerging market for optical fiber spectrometers, supported by mining, environmental monitoring, agriculture technology, and research applications. The region contributes approximately 7% of global demand, with Brazil and Chile representing key adoption centers. Industrial users are increasingly deploying spectroscopy solutions for material analysis and resource monitoring, particularly in mining operations. Around 25% of new industrial measurement projects in major economies emphasize digital monitoring capabilities. Limited local manufacturing capacity and dependence on imported optical components remain challenges. Companies are addressing these barriers through distributor partnerships, regional service expansion, and customized solutions for industrial applications.
Brazil Market Outlook: Brazil leads regional adoption due to its large mining, agricultural, and research sectors. The country’s industrial laboratories are increasingly integrating optical analysis tools for quality monitoring and environmental assessment. Partnerships with international technology providers are improving access to advanced spectroscopy platforms and supporting broader industrial digitization.
The Middle East & Africa market is gaining momentum through investments in industrial diversification, energy-sector modernization, and scientific infrastructure development. The region accounts for nearly 6% of global adoption, with demand concentrated in the United Arab Emirates, Saudi Arabia, and South Africa. Advanced monitoring requirements in energy, environmental management, and research facilities are increasing adoption of fiber-based spectroscopy systems. More than 20% of new laboratory modernization projects incorporate advanced analytical instruments. Companies are expanding through regional partnerships, service networks, and customized solutions designed for harsh industrial environments. Infrastructure development programs are creating new opportunities for precision measurement technologies.
Saudi Arabia Market Outlook: Saudi Arabia is emerging as a strategic market due to investments in industrial transformation, energy technology, and research infrastructure. The country’s laboratory modernization initiatives are increasing demand for advanced analytical equipment. Partnerships with global technology suppliers are supporting adoption of optical measurement systems across industrial and scientific applications.
The Optical Fiber Spectrometer Market features global technology leaders such as Ocean Insight, Hamamatsu Photonics, HORIBA, and Thorlabs competing with specialized regional suppliers and OEM-focused photonics manufacturers. The top five players collectively control approximately 45% of market influence. Competition is based on spectral accuracy, detector innovation, customization, delivery speed, and component reliability, with premium systems improving measurement efficiency by 20–30%. Global leaders are expanding through software integration, partnerships, and application-specific platforms, while regional suppliers compete through cost advantages and faster customization. The market is shifting toward AI-enabled spectroscopy and compact systems, increasing pressure on traditional suppliers to modernize product portfolios. High precision requirements, optical component expertise, and engineering capabilities remain major entry barriers. Winning companies must combine advanced photonics innovation, scalable manufacturing, responsive support networks, and application-focused solutions to outperform established competitors.
Hamamatsu Photonics
HORIBA Scientific
Thorlabs
Avantes
Viavi Solutions
Edmund Optics
B&W Tek
StellarNet
Wasatch Photonics
IRsweep
McPherson
Princeton Instruments
Spectral Evolution
Artificial intelligence and machine-learning spectral analytics are becoming important differentiators, enabling automated pattern recognition and reducing manual interpretation workloads by nearly 40%. Semiconductor and pharmaceutical enterprises are integrating AI workflows into spectroscopy platforms to improve defect detection and process control. Leading innovators benefit by combining hardware expertise with software ecosystems.
Miniaturized fiber spectrometers are replacing traditional laboratory systems in portable applications, delivering approximately 25% faster deployment and 30% lower setup complexity. Compact designs using advanced detectors and improved optical modules are increasing adoption in field testing, environmental monitoring, and industrial inspection. Companies investing in modular architectures gain advantages through flexible deployment models.
Future disruption between 2026 and 2028 will come from integrated photonics, cloud-connected analytics, and automated quality-control systems. Compared with older benchtop-only systems, next-generation platforms improve operational flexibility by around 30%. Manufacturers developing connected solutions, predictive analytics, and application-specific sensors will strengthen competitive positioning as industries demand faster, decentralized measurement capabilities.
February 2025 Hamamatsu Photonics introduced the FT-NIR spectrometer C16511-01 for inline process applications, improving integration with industrial workflows. The system supports automated measurement environments and strengthens process monitoring capabilities for manufacturing users. Source: www.hamamatsu.com
January 2025 Hamamatsu Photonics demonstrated spectrometer and fiber laser technologies at Photonics West, highlighting broad spectral measurement applications. The showcased OPAL-Luxe spectrometer integration delivered high dynamic range performance for advanced optical measurements, supporting research and industrial testing expansion. Source: www.lf.hamamatsu.com
September 2025 Hamamatsu Photonics released WS Series Mini-Spectrometers with reflective gratings, expanding compact spectroscopy options. The product shift targets portable analytical systems requiring smaller footprints and improved integration flexibility, supporting growth in decentralized measurement applications. Source: www.hamamatsu.com
April 2025 Hamamatsu Photonics expanded photonics product development with new sensor technologies supporting high-sensitivity optical measurement applications. The innovation strengthens detector capabilities used across spectroscopy and industrial analysis workflows, improving performance requirements for advanced instrumentation markets.
The Optical Fiber Spectrometer Market Report evaluates market dynamics across Portable Spectrometers, Benchtop Spectrometers, and Miniature Spectrometers, covering applications including semiconductor testing, pharmaceutical analysis, environmental monitoring, research, and industrial quality control. The study examines adoption patterns among semiconductor manufacturers, pharmaceutical companies, research institutions, environmental agencies, and industrial users.
The report provides regional analysis across North America, Europe, Asia-Pacific, South America, and Middle East & Africa, highlighting technology adoption, manufacturing concentration, and emerging deployment opportunities. It evaluates AI integration, miniaturized spectroscopy, automation trends, competitive positioning, and innovation strategies. The analysis supports investment planning, expansion decisions, partnership development, and long-term positioning by identifying operational shifts and technology priorities shaping the market between 2026 and 2033.
| Report Attribute / Metric | Details |
|---|---|
| Market Revenue (2025) | USD 446.7 Million |
| Market Revenue (2033) | USD 628.5 Million |
| CAGR (2026–2033) | 4.36% |
| Base Year | 2025 |
| Forecast Period | 2026–2033 |
| Historic Period | 2021–2025 |
| Segments Covered |
By Type
By Application
By End-User
|
| Key Deliverables | Revenue Forecast; Market Trends; Growth Drivers & Restraints; Technology Insights; Segmentation Analysis; Regional Insights; Competitive Landscape; Regulatory & ESG Overview; Recent Developments |
| Regions Covered | North America; Europe; Asia-Pacific; South America; Middle East & Africa |
| Companies Profiled | Ocean Insight; Hamamatsu Photonics; HORIBA Scientific; Thorlabs; Avantes; Viavi Solutions; Edmund Optics; B&W Tek; StellarNet; Wasatch Photonics; IRsweep; McPherson; Princeton Instruments; Spectral Evolution |
| Customization & Pricing | Available on Request (10% Customization Free) |