
Reports
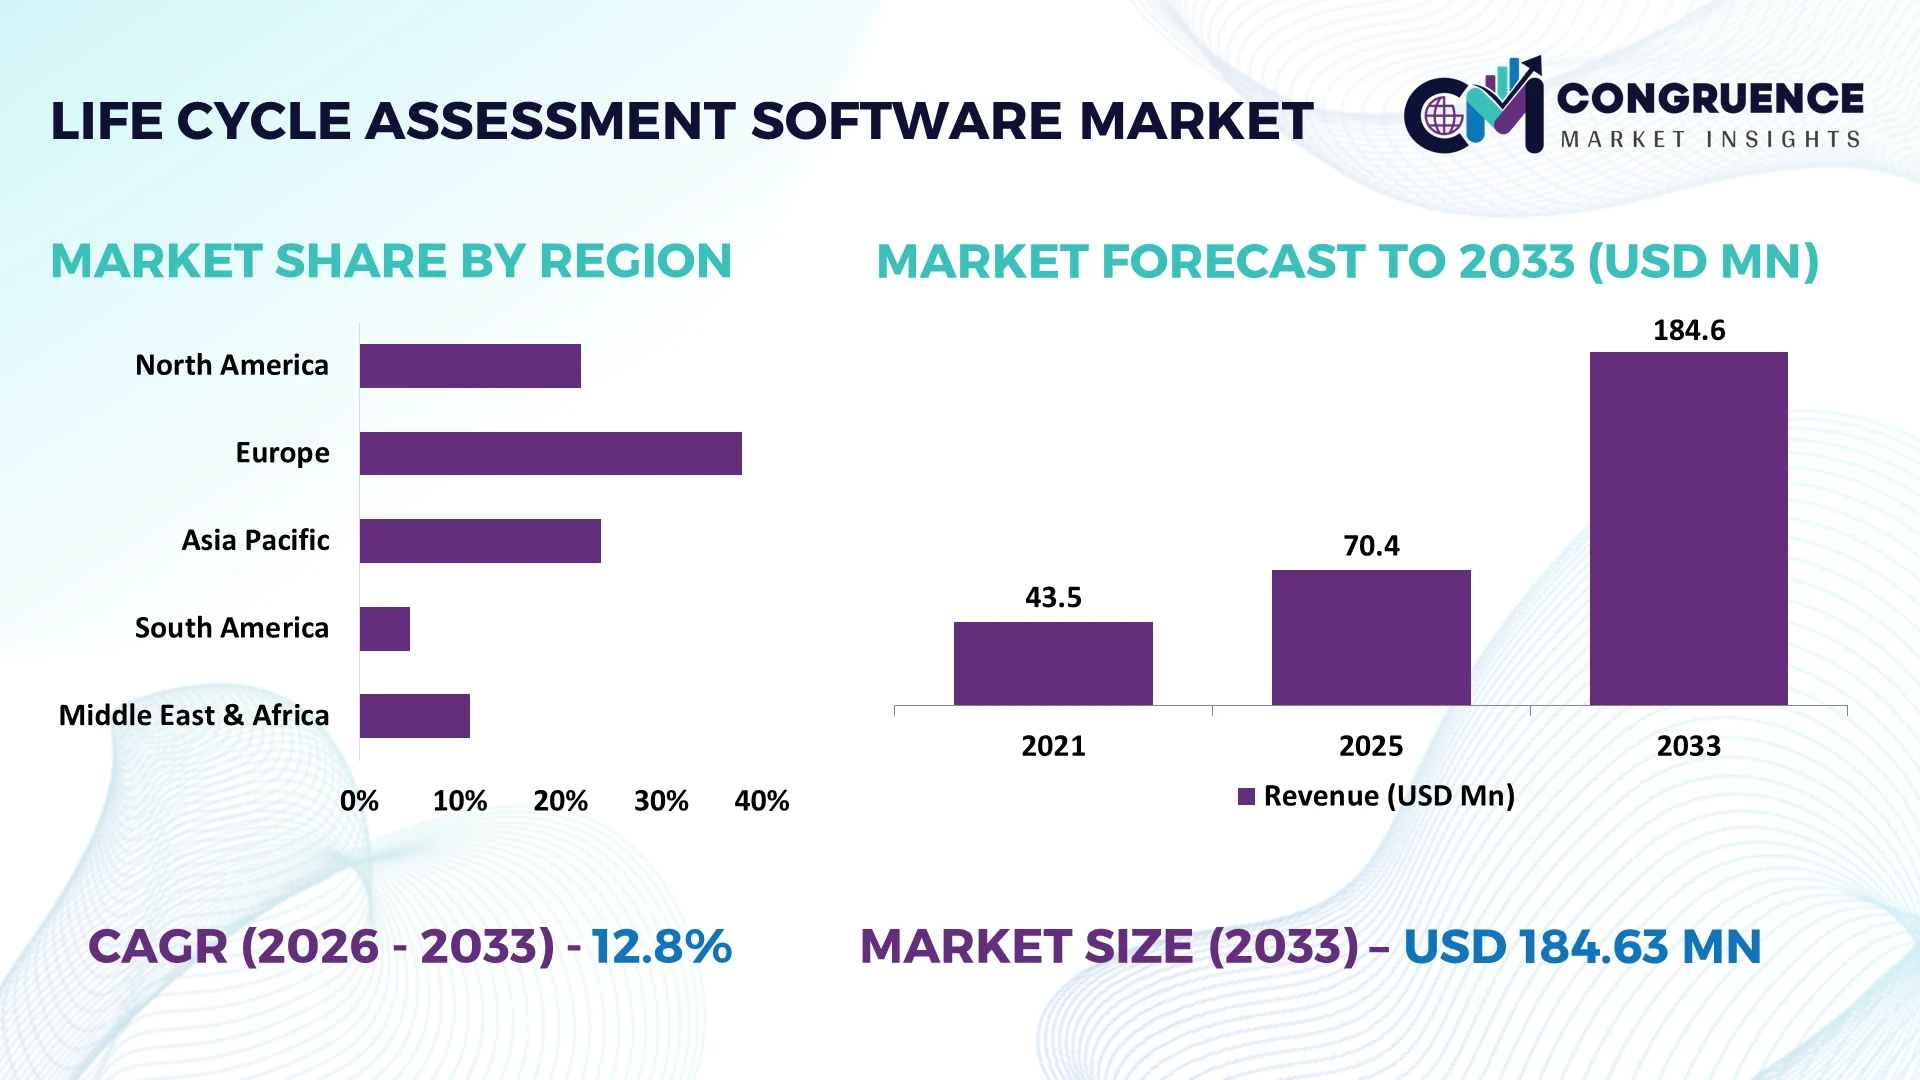
The Global Life Cycle Assessment Software Market was valued at USD 70.44 Million in 2025 and is anticipated to reach a value of USD 184.63 Million by 2033 expanding at a CAGR of 12.8% between 2026 and 2033. Growth is driven by product carbon footprint accounting, EU sustainability regulation, digital product passports, supplier-level emissions measurement, and automated environmental impact modeling across complex value chains.
Germany represents an estimated 16% of global Life Cycle Assessment Software adoption, supported by automotive, chemicals, industrial machinery, construction, and packaging companies integrating product-level environmental data into engineering decisions. Manufacturing generates about 23% of German greenhouse-gas emissions, strengthening demand for material and process impact modeling. Compared with the United States, German deployments carry stronger product-compliance requirements as the EU Carbon Border Adjustment Mechanism entered its definitive phase in 2026, increasing demand for traceable embedded-emissions data across imported industrial products.
For software vendors and industrial buyers, competitive advantage now depends on converting supplier, material, energy, and production data into auditable product-level environmental intelligence before compliance becomes embedded in procurement and product design.
Market Size & Growth: USD 70.44 million in 2025 reaches USD 184.63 million by 2033 at 12.8%, driven by product-carbon-footprint digitization and regulatory reporting.
Top Growth Drivers: Scope 3 emissions representing above 70% of many corporate footprints, 100% CBAM certificate obligations, and 50%+ supplier-data dependence accelerate LCA adoption.
Short-Term Forecast: By 2028, automated data ingestion can reduce manual LCA data preparation by approximately 30%, shortening environmental assessment cycles.
Emerging Technologies: AI-assisted modeling, digital twins, and automated supplier-data mapping are shifting LCA from specialist analysis toward continuous product intelligence.
Regional Leaders: By 2033, Europe approaches USD 72 million, North America USD 57 million, and Asia-Pacific USD 42 million as compliance-led and manufacturing deployments expand.
End-User Trends: Manufacturing-related value chains can place more than 70% of lifecycle emissions upstream, increasing supplier-specific footprint modeling requirements.
Pilot/Case Example: 2025 digital product-footprint programs targeted 20%–30% reductions in manual data handling through automated bill-of-material and emissions-factor mapping.
Competitive Landscape: Sphera holds an estimated 16% share, competing with One Click LCA, SimaPro, Ecochain, and Makersite on databases, automation, and enterprise integration.
Regulatory & ESG Impact: CBAM entered its definitive phase in 2026, covering 6 carbon-intensive product groups and strengthening demand for auditable embedded-emissions calculations.
Investment & Funding: Climate-software investment exceeds USD 1 billion globally across carbon intelligence categories, directing capital toward automated LCA, supplier traceability, and product-footprint platforms.
Innovation & Future Outlook: Digital Product Passport requirements will progressively reshape 2027 onward workflows, connecting lifecycle datasets with product identity, material provenance, circularity, and compliance records.
Life Cycle Assessment Software Market demand is shifting toward continuous product carbon footprinting, eco-design, supplier emissions intelligence, circularity assessment, and regulatory documentation across automotive, chemicals, construction, electronics, packaging, and consumer products. Advanced platforms increasingly automate bill-of-material mapping, emissions-factor selection, scenario comparison, and primary supplier-data ingestion, reducing dependence on manually assembled studies. With upstream Scope 3 activities frequently representing more than 70% of corporate footprints, supplier-level lifecycle visibility is becoming operationally critical. EU product sustainability and CBAM requirements reinforce this transition, setting the foundation for deeper strategic analysis.
Life Cycle Assessment software is becoming strategic infrastructure for manufacturers as environmental performance moves from periodic disclosure into product design, procurement, and market access. EU Carbon Border Adjustment Mechanism implementation in 2026 strengthens demand for traceable embedded emissions, while Digital Product Passport requirements are pushing lifecycle data into product information architectures. For industries where upstream activities exceed 70% of total footprints, supplier-specific environmental intelligence increasingly influences sourcing and material substitution.
Automated LCA platforms can reduce data preparation effort by roughly 30% versus spreadsheet-led assessments by connecting bills of materials, ERP records, supplier datasets, and emissions factors. Germany leads compliance-oriented industrial deployment across automotive, chemicals, machinery, and construction, while US adoption places greater emphasis on product innovation and corporate carbon management. A vehicle manufacturer can now compare alternative battery chemistries across materials, manufacturing, transport, use, and end-of-life scenarios before engineering release.
Through 2028, automated primary-data exchange and product-footprint calculation will become central investment areas. Software providers are expanding database partnerships and engineering integrations, while manufacturers embed LCA earlier in product development. Competitive positioning will increasingly depend on converting lifecycle evidence into faster design, procurement, and compliance decisions.
Product-level carbon regulation is moving LCA from specialist sustainability teams into engineering and procurement workflows. Scope 3 activities frequently exceed 70% of corporate emissions, while purchased goods can represent more than 50% of manufacturing value-chain footprints. EU CBAM entered its definitive phase in 2026, increasing requirements for embedded-emissions information across carbon-intensive imports. German automotive, metals, chemicals, and machinery companies consequently require supplier-specific datasets rather than generic corporate averages. This shift makes lifecycle modeling operationally relevant to sourcing eligibility, material selection, and product documentation. Software providers are expanding automated product carbon footprint engines, verified datasets, and ERP integrations. Manufacturers are simultaneously investing in supplier-data programs and digital compliance infrastructure. The strategic shift is decisive: environmental data quality increasingly affects product marketability, not merely sustainability reporting.
Incomplete supplier data remains the principal structural limitation because lifecycle models often depend on secondary emissions factors when primary process information is unavailable. Upstream activities can contribute above 70% of total footprints, yet primary supplier coverage can remain below 50% across complex multi-tier manufacturing networks. Electronics products can contain components sourced through thousands of supplier relationships, making consistent material, energy, transport, and geographic data difficult to maintain. Chinese and Southeast Asian supply-chain diversification further complicates dataset comparability when factories operate with different electricity mixes and reporting maturity. Weak primary coverage reduces calculation precision and limits procurement-level differentiation between suppliers. Companies are responding with supplier portals, standardized data templates, verified environmental product declarations, and contractual reporting requirements. Software vendors are adding uncertainty scoring and database fallback mechanisms to preserve usable assessments where primary information remains incomplete.
Digital Product Passports create an opportunity to move lifecycle intelligence beyond sustainability reporting into persistent product-level data services. EU policy is progressively requiring structured information on materials, environmental characteristics, durability, and circularity, while automated LCA workflows can cut assessment preparation time by approximately 30%. Product architectures containing more than 1,000 components create particularly strong demand for automated bill-of-material mapping and reusable footprint datasets. Germany, France, and Italy offer substantial opportunity across automotive, batteries, machinery, textiles, and construction products. Vendors are developing APIs that connect lifecycle engines with PLM, ERP, supplier, and passport systems while expanding industry-specific databases. A non-obvious opportunity is dataset reuse: once validated component footprints are embedded digitally, manufacturers can model redesigns and supplier substitutions without rebuilding assessments, lowering marginal analysis cost and accelerating eco-design decisions.
Scaling LCA from individual studies to thousands of continuously changing products creates a governance challenge distinct from basic data availability. A complex manufactured product can contain more than 10,000 components, while engineering changes can alter material, supplier, location, and transport assumptions throughout its lifecycle. Even a 5% variance in high-impact input data can materially change comparative product conclusions, making version control and methodology consistency critical. Multinational manufacturers must also reconcile ISO-based assessment practices with evolving product-specific rules in the EU, United States, and Asian markets. Companies therefore need controlled calculation methodologies, dataset lineage, cybersecurity, specialist lifecycle expertise, and integration with PLM and ERP change management. Vendors are investing in automated validation, permission frameworks, audit trails, and interoperable data models. Long-term advantage requires scaling environmental intelligence without sacrificing reproducibility or decision-grade accuracy.
Primary Data Replaces Industry Averages: Manufacturers are increasing supplier-specific inputs to improve product-footprint precision. Microsoft raised primary-data representation to 70% of device carbon footprints versus roughly 20% typical coverage for laptops and tablets. Companies are scaling supplier exchanges and automated validation, allowing procurement teams to distinguish actual component hotspots from database averages and prioritize measurable interventions.
Cloud Workflows Replace Desktop Silos: Cloud deployment now represents roughly 73% of LCA software adoption, enabling engineering, procurement, sustainability, and supplier teams to access shared models. Platforms increasingly connect ERP and product data rather than importing static files. Companies are expanding SaaS architectures and APIs, reducing model duplication while accelerating multi-product assessments across geographically distributed operations.
BIM Integration Moves Upstream: Construction teams are connecting LCA with building information models to evaluate embodied impacts before specifications are locked. A 2025 industry study found 82% of participants used sustainability strategies, 45% performed LCA, but only 29% used BIM-LCA tools. Software developers are strengthening BIM interoperability so architects can compare material alternatives earlier and avoid expensive late-stage redesign.
Hybrid Carbon Toolchains Persist: Specialized platforms are expanding without eliminating spreadsheets. In 2025, European Scope 3 practitioners reported 23.6% usage for LCA tools versus 32.7% for spreadsheets; North American LCA usage stood at 16.7%. Vendors are therefore improving exports, APIs, and data connectors instead of forcing closed workflows, recognizing interoperability as a purchasing criterion.
Cloud-Based solutions lead the type landscape with an estimated 73% share, reflecting their scalability, centralized databases, automatic updates, and ability to connect distributed sustainability, engineering, and supplier teams. Their advantage strengthens where enterprises assess hundreds or thousands of products because reusable datasets and shared models reduce duplicate work. Process-Based and Product-Based systems remain important for detailed manufacturing studies and product environmental assessments, respectively, while On-Premise deployments retain relevance where organizations require tighter internal data control.
Supply Chain-Based LCA is the fastest-growing type as organizations shift from internally modeled averages toward supplier-specific environmental inventories. Upstream activities can represent more than 70% of corporate footprints, making value-chain visibility operationally significant. Platforms increasingly automate supplier-data collection, emissions-factor mapping, and product carbon footprint exchange; ERP-centric systems can map more than 45,000 predefined emission factors. Vendors are consequently investing in cloud APIs, supplier networks, database partnerships, and scalable calculation engines, redirecting product development toward continuous value-chain assessment rather than isolated lifecycle studies.
Carbon Footprinting leads applications with an estimated 31% share as manufacturers require product-level greenhouse-gas calculations for customer requests, procurement decisions, corporate inventories, and trade-related disclosure. Environmental Reporting and Regulatory Compliance remain mature applications where standardized methodologies and audit trails support disclosure workflows. Product Assessment extends lifecycle intelligence into comparative product decisions, while Sustainability Management aggregates results across portfolios. Automated data mapping can reduce assessment preparation effort by approximately 30%, strengthening the economics of repeated calculations.
Supply Chain Analysis is the fastest-growing application as enterprises pursue primary supplier information instead of relying predominantly on secondary datasets. Microsoft’s hardware assessments now derive 70% of device carbon footprints from primary data versus approximately 20% typical coverage for laptops and tablets, demonstrating the accuracy shift underway. Eco-Design is also advancing as lifecycle models move earlier into material and engineering decisions. Software companies are expanding supplier-data interfaces, scenario engines, and PLM integration, making LCA outputs increasingly actionable for sourcing, redesign, and portfolio optimization rather than solely retrospective disclosure.
Manufacturing is the dominant end-user, accounting for an estimated 36% share because material selection, energy consumption, production processes, logistics, and supplier networks generate extensive lifecycle datasets. Automotive and Chemicals represent established adopters where complex bills of materials and process emissions require detailed environmental modeling. Construction adoption is expanding through BIM integration, while Energy uses lifecycle analysis to compare infrastructure technologies. Food & Beverage applies LCA across agriculture, processing, packaging, and distribution, where upstream inputs materially influence environmental profiles.
Consumer Goods is the fastest-growing end-user as retailers and brand owners request product-specific carbon information across increasingly extensive supplier networks. Electronics is similarly advancing because semiconductor manufacturing, electricity consumption, component sourcing, and end-of-life treatment create multi-stage footprints. In construction, 45% of surveyed practitioners reported LCA experience in 2025, but only 29% used integrated BIM-LCA tools, leaving significant digitization headroom. Vendors are responding with sector-specific datasets, automated product-footprint templates, engineering connectors, and supplier-engagement capabilities, positioning lifecycle intelligence directly within product-development and procurement ecosystems.
Europe accounted for the largest market share at 39% in 2025 however, Asia-Pacific is expected to register the fastest growth, expanding at a CAGR of 14.6% between 2026 and 2033.
Enterprise Carbon Intelligence Moves Into Product Engineering
North America accounted for approximately 31% of Life Cycle Assessment Software adoption in 2025, supported by extensive cloud infrastructure and sustainability digitization across technology, automotive, construction, chemicals, and consumer goods. US enterprises are moving lifecycle analysis from periodic sustainability studies into product engineering and procurement systems, increasing demand for automated bill-of-material mapping and supplier-specific environmental datasets. Electronics companies provide an advanced deployment benchmark: primary supplier and semiconductor data now account for about 70% of some device carbon footprints, compared with roughly 20% typical primary-data coverage for laptops and tablets. Canadian adoption is more concentrated in energy, mining, construction, and industrial materials. Platform providers are responding with enterprise APIs, product-carbon-footprint automation, cloud calculation engines, and integrations connecting lifecycle intelligence with ERP and product-development environments.
United States Market Outlook: The United States combines deep enterprise software adoption with extensive electronics, technology, chemicals, automotive, and consumer-products ecosystems. Manufacturing contributes roughly 10% of national economic output, creating a substantial base for process and product assessment. Companies are prioritizing primary supplier information and automated scenario analysis to improve material decisions, Scope 3 visibility, and product environmental claims.
Regulation Embeds LCA Into Product Governance
Europe held approximately 39% of the market in 2025, supported by mature environmental assessment practices and regulation linking lifecycle information with industrial products. Germany, France, the Netherlands, Italy, and Nordic economies concentrate adoption across automotive, chemicals, construction, machinery, packaging, and consumer goods. EU Ecodesign for Sustainable Products Regulation implementation is pushing companies toward structured product environmental information, while CBAM entered its definitive regime in 2026 for carbon-intensive imports. Specialized LCA tool usage among European supply-chain practitioners reached approximately 23.6%, exceeding comparable North American penetration. Enterprises are integrating lifecycle engines with product lifecycle management, BIM, procurement, and supplier-data systems rather than maintaining standalone assessments. Vendors are expanding European databases, environmental product declaration workflows, regulatory templates, and Digital Product Passport interoperability, making regulatory readiness a direct software-selection criterion.
Germany Market Outlook: Germany provides the strongest industrial deployment environment through automotive, machinery, chemicals, building products, and materials manufacturing. Industry contributes around one-quarter of national gross value added, generating extensive product and process datasets suitable for lifecycle modeling. German manufacturers increasingly integrate LCA with engineering workflows to evaluate alternative materials, energy inputs, suppliers, and production routes before product specifications become commercially fixed.
Export Manufacturing Accelerates Footprint Digitization
Asia-Pacific represented approximately 22% of Life Cycle Assessment Software demand in 2025, with deployment concentrated in China, Japan, South Korea, Australia, India, and Singapore. Export-oriented automotive, electronics, batteries, chemicals, metals, textiles, and consumer-goods manufacturers are strengthening product-footprint capabilities as overseas customers request increasingly granular environmental data. China accounts for more than 30% of global manufacturing value added, giving lifecycle platforms exceptional scale potential across complex supplier networks. Japanese enterprises emphasize detailed process inventories and product engineering, while South Korean electronics and battery producers require material-level traceability across international supply chains. Software providers are expanding localized databases, multilingual interfaces, supplier-data exchange, and cloud integrations. The operational shift is particularly important for exporters because lifecycle evidence is becoming embedded in customer qualification, low-carbon procurement, and product documentation rather than remaining confined to corporate sustainability teams.
China Market Outlook: China combines unmatched manufacturing scale with extensive electronics, batteries, steel, chemicals, machinery, solar equipment, and consumer-goods supply chains. Its manufacturing sector contributes roughly 26% of domestic economic output, creating substantial demand for process-level environmental modeling. Exporters are investing in product carbon footprint systems that connect factory energy, material sourcing, logistics, and supplier information with increasingly stringent overseas procurement requirements.
Export Supply Chains Drive Selective Adoption
South America accounts for approximately 4% of Life Cycle Assessment Software adoption, led by Brazil and followed by Chile, Argentina, and Colombia. Demand is concentrated in food and beverage, mining, pulp and paper, chemicals, construction materials, energy, and export-oriented manufacturing, where environmental performance increasingly influences international procurement. Brazil's electricity system derives more than 80% of generation from renewable sources, creating distinctive lifecycle advantages for electricity-intensive products but requiring accurate datasets to translate that advantage into product footprints. Agricultural and commodity exporters are also examining land-use, processing, packaging, and logistics impacts across extended value chains. Adoption remains constrained by uneven supplier-data maturity and specialist availability. Software vendors are addressing these limitations through cloud delivery, Portuguese and Spanish interfaces, standardized databases, consulting partnerships, and simplified footprinting modules suited to companies beginning systematic lifecycle measurement.
Brazil Market Outlook: Brazil offers the region's strongest deployment base through diversified manufacturing and globally connected agribusiness, mining, steel, pulp, chemicals, food, and consumer-products industries. Manufacturing contributes about 13% of domestic output. Access to a comparatively low-carbon electricity mix strengthens the value of granular LCA because producers can quantify environmental differentiation rather than relying on global-average energy factors in export assessments.
Industrial Diversification Expands Lifecycle Measurement
Middle East & Africa represents approximately 4% of Life Cycle Assessment Software activity, with adoption concentrated in the United Arab Emirates, Saudi Arabia, South Africa, and export-oriented industrial clusters. Demand is strongest across energy, petrochemicals, metals, construction, mining, and building materials, where embodied carbon increasingly influences procurement and international customer requirements. Saudi industrial diversification is creating new lifecycle-data requirements across chemicals, metals, construction products, and emerging manufacturing investments, while UAE developers increasingly assess embodied impacts within large construction portfolios. South Africa adds demand from mining, energy, and resource-intensive exports. Gulf cloud infrastructure and digital industrial programs are improving the technical foundation for SaaS lifecycle platforms. Vendors are responding with localized emissions datasets, construction-oriented assessment tools, carbon-accounting integration, and implementation partnerships capable of supporting organizations with limited internal LCA expertise.
Saudi Arabia Market Outlook: Saudi Arabia is strategically significant because industrial policy is expanding manufacturing beyond hydrocarbons while existing petrochemical, metals, cement, and energy operations face increasing carbon-transparency requirements. The country targets approximately 50% renewable electricity generation by 2030, making prospective energy-mix changes important for lifecycle calculations. Industrial companies are consequently strengthening environmental-data systems to compare production pathways and document export-product footprints.
Sphera, One Click LCA, SimaPro, Makersite, and Ecochain compete across enterprise LCA, product footprinting, construction assessment, and supply-chain intelligence, with the top five holding an estimated 48% combined share. Sphera challenges specialist platforms through enterprise databases and compliance integration, while One Click LCA differentiates in construction and SimaPro retains strength in practitioner-grade modeling. Makersite and Ecochain compete through automated product and supply-chain assessment. Cloud automation can reduce assessment preparation effort by roughly 30%, while primary-data integration can improve footprint specificity by over 50% versus secondary-data-heavy models. Competition is shifting from standalone calculation toward ERP, PLM, BIM, and supplier-network integration. Vendors are expanding databases, APIs, industry templates, partnerships, and AI-assisted modeling. High-quality lifecycle datasets, methodological credibility, interoperability, and specialist expertise remain substantial entry barriers. Winning requires scalable calculations, auditable data lineage, sector-specific intelligence, rapid integration, and decision-ready environmental analytics embedded directly within engineering and procurement workflows.
Sphera
One Click LCA
SimaPro
Makersite
Ecochain
iPoint-systems
EarthShift Global
GreenDelta
Solid Forest
Carbon Minds
2030 Calculator
Sustainable Minds
Minviro
Trayak
Current LCA platforms combine cloud calculation engines, lifecycle databases, automated bill-of-material mapping, and ERP, PLM, BIM, and supplier-data integrations. Automation can make portfolio assessments up to 99% faster than consultant-led workflows, while advanced platforms process millions of product footprints. Cloud deployment lets engineering, procurement, and sustainability teams reuse verified datasets, reducing duplicated modeling and accelerating product-carbon decisions.
Emerging technology centers on AI-driven material mapping, digital twins, primary-data matching, and automated Environmental Product Declaration generation. Makersite-supported modeling increased Microsoft’s supplier-primary-data coverage from about 20% to above 70%, a 50-percentage-point improvement over its previous methodology. AI links components to manufacturing datasets and identifies environmental hotspots faster than manual practitioner selection. Manufacturers with complex electronics, automotive, chemical, and construction portfolios gain the strongest competitive advantage from this granularity.
Through 2026–2028, disruptive development will shift toward continuously updated product sustainability twins, interoperable Digital Product Passports, and machine-assisted scenario optimization. Platforms already support 500,000-plus datasets, while enterprise automation can move assessments from months to minutes. Vendors integrating lifecycle intelligence directly into design and procurement systems will outperform standalone calculators because teams can test material, supplier, energy, cost, and carbon trade-offs before specifications freeze. Acting now builds validated data foundations for scalable compliance and eco-design.
July 2024 Makersite partnered with Carbon Minds to integrate its complete chemicals and plastics database into Makersite’s product-lifecycle intelligence platform. The integration expands regionalized chemical footprint coverage, strengthening material-level design, sourcing, regulatory reporting, and supply-chain decisions across complex industrial portfolios. Source: makersite.io
April 2025 Sphera launched SpheraCloud LCA Database Server and Portfolio Analyzer, centralizing lifecycle data management and portfolio-level environmental analysis. Its underlying LCA ecosystem contains more than 20,000 process datasets, enabling manufacturers to improve data consistency, collaboration, footprint visualization, and assessment scalability. Source: sphera.com
September 2025 One Click LCA acquired SimaPro and PRé Sustainability, creating a combined platform containing more than 500,000 lifecycle datasets and serving over 5,000 companies. The consolidation combines SimaPro’s scientific modeling depth with One Click LCA’s automation, integrations, and scalable enterprise workflows. Source: oneclicklca.com
June 2026 One Click LCA expanded its platform with AI-powered features, workflow automation, scalable EPD creation, Life Cycle Costing, Materials Passports, and portfolio analytics. The release extended lifecycle intelligence across 5 major workflow areas, helping construction and manufacturing teams operationalize sustainability earlier. Source: oneclicklca.com
The report evaluates Life Cycle Assessment Software across five types, seven applications, and eight end-user industries, covering Process-Based, Product-Based, Supply Chain-Based, Cloud-Based, and On-Premise deployment models. Application analysis examines carbon footprinting, product assessment, environmental reporting, eco-design, supply-chain analysis, sustainability management, and regulatory compliance across manufacturing-intensive value chains. Geographic coverage spans North America, Europe, Asia-Pacific, South America, and Middle East & Africa with country-level deployment assessment.
Technology coverage includes AI-assisted lifecycle modeling, cloud automation, digital twins, BIM and PLM integration, primary supplier-data matching, automated EPD generation, and Digital Product Passports. The report evaluates established LCA platforms alongside emerging product-intelligence models, supporting investment planning, geographic expansion, technology partnerships, competitive benchmarking, compliance strategy, and portfolio prioritization through 2033.
| Report Attribute/Metric | Report Details |
|---|---|
Market Revenue in 2025 | USD 70.44 Million |
Market Revenue in 2033 | USD 184.63 Million |
CAGR (2026 - 2033) | 12.8% |
Base Year | 2025 |
Forecast Period | 2026 - 2033 |
Historic Period | 2021 - 2025 |
Segments Covered | By Type
By Application
By End-User
|
Key Report Deliverable | Revenue Forecast, Growth Trends, Market Dynamics, Segmental Overview, Regional and Country-wise Analysis, Competition Landscape |
Region Covered | North America, Europe, Asia-Pacific, South America, Middle East, Africa |
Key Players Analyzed | Sphera, One Click LCA, SimaPro, Makersite, Ecochain, iPoint-systems, EarthShift Global, GreenDelta, Solid Forest, Carbon Minds, 2030 Calculator, Sustainable Minds, Minviro, Trayak |
Customization & Pricing | Available on Request (10% Customization is Free) |